
Monthly Market Commentary - October 2024
Monthly Market Commentary - October 2024
Market Update
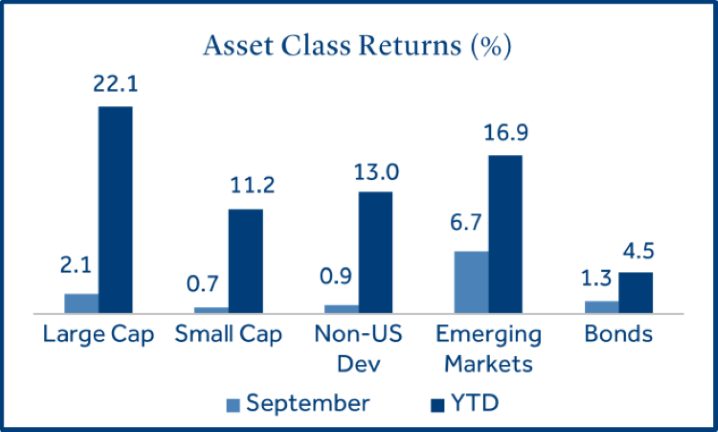
Emerging market stocks led modest asset class returns as China unveiled a new stimulus package.
The S&P 500 Index rebounded to deliver a positive return in September after beginning the month with its largest weekly decline of 2024. Growing concerns over the potential for inflation to reaccelerate and economic growth to moderate each contributed to the volatility. Against this backdrop:
- Investors preferred stability in large caps: Large caps (S&P 500 Index) gained +2.1% and outperformed small caps (Russell 2000 Index) which returned +0.7%. Large cap stocks were resilient and recaptured all their losses from early in the month. However, concerns around moderating economic growth tempered small cap performance.
- Bonds posted their fifth straight month of gains: Bonds (Bloomberg US Aggregate Bond Index) returned +1.3% as interest rates moved lower for the fifth consecutive month. The 10-year U.S. Treasury yield declined from 3.91% to 3.81% (-0.10%) in September.
- Emerging markets (EM) topped developed markets as Chinese stocks outperformed: EM stocks (MSCI EM Index) gained +6.7% and outperformed non-U.S. developed markets (MSCI EAFE Index) which returned +0.9%. Chinese stocks (+23.9%) boosted EM returns as the Bank of China announced its largest economic stimulus plan since the pandemic.
U.S. Equities
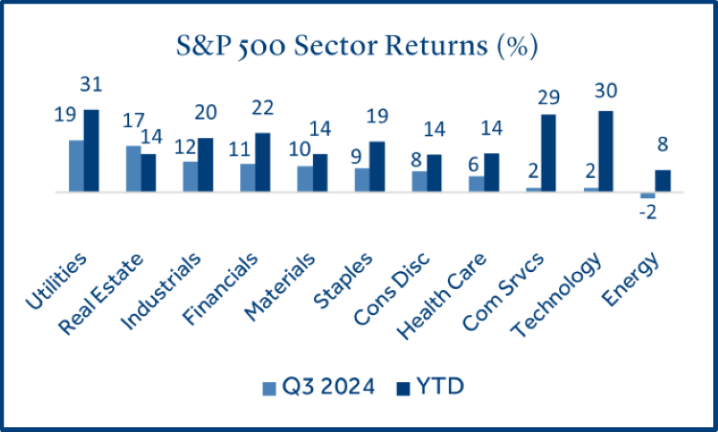
Dividend paying large caps led returns in the third quarter as volatility increased and interest rates fell.
U.S. stock market leadership shifted to higher yielding sectors in the third quarter as long-term Treasury yields trended lower and the Federal Reserve (Fed) cut short-term interest rates in September.
- Utilities and Real Estate excelled as Treasury yields declined: Utilities gained momentum as their dividend yield may look more attractive when bond yields decline, and they often exhibit defensive characteristics during market volatility. Real estate stocks performed well as lower rates and moderate economic growth often translate to lower financing costs and consistent cash flows from tenants, which is supportive of REITs.
- Energy stocks underperformed as oil prices declined: Softening demand for oil has resulted in elevated inventories in the U.S. Additionally, OPEC planned to begin phasing out production cuts next month, which would likely add to the poor supply and demand dynamic for oil.
- 79% of S&P 500 firms exceeded Q2 earnings-per-share (EPS) estimates: This is above the five-year average of 77%. However, only 60% of firms exceeded expectations for revenue, below the five-year average of 69%1. The combination of better than average EPS growth and below average revenue growth could imply that cost cutting measures and share repurchases have boosted earnings more than organic growth
Fixed Income
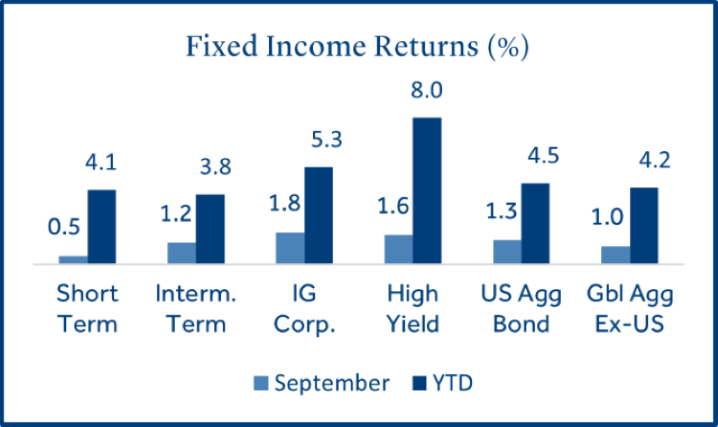
Bonds benefited from declining interest rates as the yield curve has started to normalize.
Lower interest rates across the yield curve led to positive returns for most fixed income sectors and durations.
- Short-term bonds yields declined the most on expectations for a Fed rate cut: Short-term interest rates declined during the month in anticipation of the Fed’s rate decision. Long-term rates, which are dictated by market supply and demand, declined less than short-term rates which caused the treasury yield curve to begin to normalize, or “de-invert”.
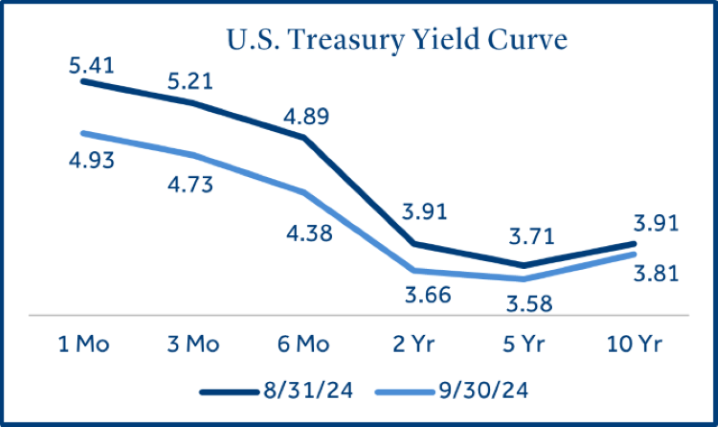
- Investment grade (IG) corporate bonds led fixed income returns: IG corporates (rated BBB and above) benefited from a decline in yields and modest spread tightening during the month. There continued to be significant demand for high quality corporate bonds as 2024 new issuance is expected to be near all-time highs2.
Federal Reserve
The Fed delivered its first interest rate cut since 2020 and additional cuts are expected in 2024.
The Fed justified lower lending rates in September as it gained greater confidence that inflation was well managed, an indication it is shifting its attention to weakening employment metrics.
- The Fed opted for a 50 basis point cut amid mixed market expectations: Heading into the FOMC meeting on September 18, the futures market reflected a 60% probability of a -0.50% rate cut but only 10% of economists surveyed by Bloomberg correctly forecasted the size of the cut3. Further, one Fed governor voted for a -0.25% cut, the first dissent in a FOMC vote since 2005.
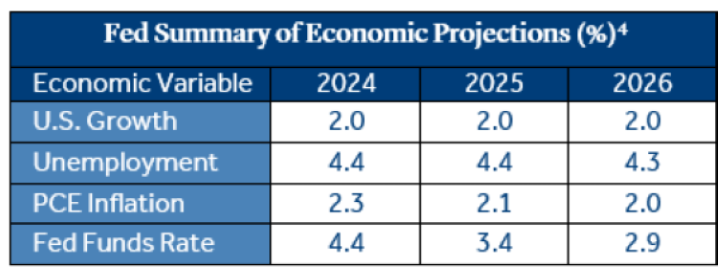
- Revised economic projections suggested a soft landing: The Fed projected steady growth and declining inflation over the next two years. However, they did modestly increase their estimate for unemployment from 4.0% in 2024 and 4.2% in 2025, to 4.4% for each year. This suggests the Fed does not expect much further deterioration in the labor market with the current unemployment rate at 4.2%.
- A shift to more “dovish” economic policy could be positive for risk assets: Given the Fed’s relatively upbeat projections for the economy, their decision to lower rates -0.50% (versus -0.25%) was a surprise to many market pundits. The larger cut could reflect their commitment to a “soft landing” for the U.S. economy, which has the potential to provide a boost to equities. However, if the Fed is unable to deliver a “soft landing”, more defensive assets could be poised to outperform.
Recession Watch
A softening U.S. employment market has sparked concerns of a looming recession.
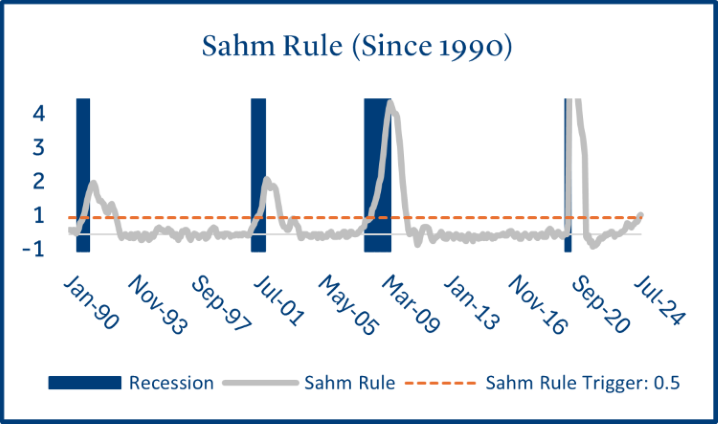
The U.S. unemployment rate has risen from 3.7% to 4.2% in 2024 which triggered a widely followed recession indictor known as the “Sahm Rule”.
- The “Sahm Rule” has been the subject of recent media attention as it has coincided with every recession since 1970: The rule was created as a tool to help policymakers diagnose the early signs of a recession. It states that when the three-month moving average for the unemployment rate rises 0.5% above its 12-month low, the economy is likely in the early stages of a recession. A series of weaker than expected labor reports officially triggered the Sahm rule in August.
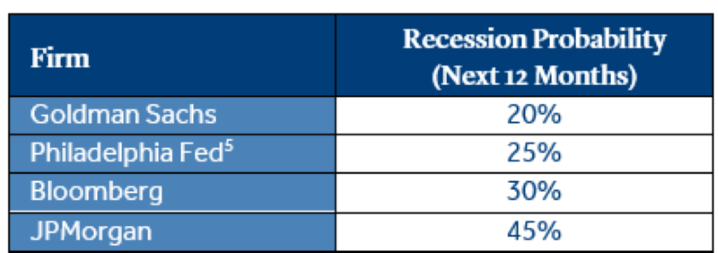
- Many firms still believe the U.S. is likely to avoid a recession over the next 12 months: Most firms agree the state of the labor market is critically important to avoiding a recession. However, they also believe that recent jobless claims are trending lower (unemployment did dip in August by -0.1%), the U.S. consumer remains strong, and the Fed’s shift to easy policy will all support a soft landing.
Economic Calendar
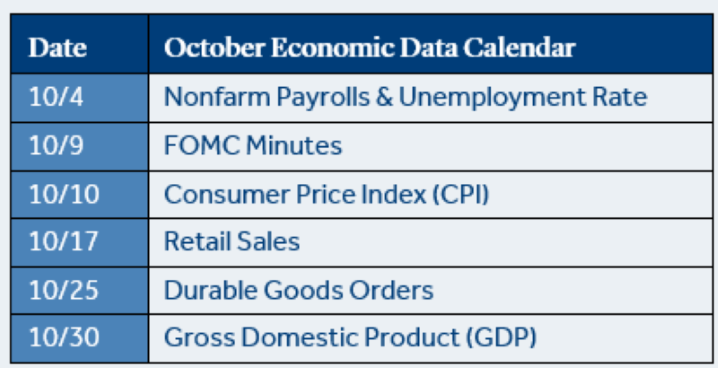
The Fed’s focus may be transitioning from elevated inflation to a softening labor market.
- U.S. job growth was lower than estimated for the second straight month: New jobs for in August expanded by +142k, more than the +89k created in July but below the consensus forecast of +161k. Unemployment did tick lower from 4.3% to 4.2% and ended a streak of four consecutive monthly increases. Policymakers recently stated they believe the risks to inflation and unemployment are in balance for the first time in years. If the labor market continues to soften, we may see the Fed’s focus transition from taming inflation to supporting job growth.
- Retail sales continued to signal consumer spending remains strong: August retail sales advanced +0.1% for the month and topped estimates of a -0.2% decline. It was a strong read not only because it topped expectations by +0.3%, but also because July was exceptionally strong (+1.1%) and consumers continued to boost spending. Consumer spending is critical to economic growth as it is estimated to account for more than two-thirds of U.S. GDP.
- Annualized inflation (CPI) hit its lowest level since February 2021: Monthly CPI increased +0.2% in August (meeting expectations). The 12-month inflation rate was +2.5% and declined -0.4% from last month (+2.9%). Conversely, core CPI data, which excludes volatile food and energy prices, rose +0.3% and conflicted with improving broader inflation metrics. The rise in core CPI was mainly due to higher shelter and transport prices.
To download the printable version, CLICK HERE
Data and rates used were indicative of market conditions as of the date shown. Opinions, estimates, forecasts, and statements of financial market trends are based on current market conditions and are subject to change without notice. This material is intended for general public use and is for educational purposes only. By providing this content, Park Avenue Securities LLC is not undertaking to provide any recommendations or investment advice regarding any specific account type, service, investment strategy or product to any specific individual or situation, or to otherwise act in any fiduciary or other capacity. Please contact a financial professional for guidance and information that is specific to your individual situation. Indices are unmanaged and one cannot invest directly in an index. Links to external sites are provided for your convenience in locating related information and services. Guardian, its subsidiaries, agents, and employees expressly disclaim any responsibility for and do not maintain, control, recommend, or endorse third-party sites, organizations, products, or services and make no representation as to the completeness, suitability, or quality thereof. Past performance is not a guarantee of future results.
Asset class returns sourced from Morningstar Direct. Asset categories listed correspond to the following underlying indices: Large Cap (S&P 500), Small Cap (Russell 2000), Non-US Dev (MSCI EAFE), Emerging Markets (MSCI EM), Bonds (Bloomberg US Aggregate Bond), Utilities Sector (S&P 500 Sector/Utilities), Real Estate Sector (S&P 500 Sector/Real Estate), Industrials Sector (S&P 500 Sector/Industrials), Financials Sector (S&P 500 Sector/Financials), Consumer Staples Sector (S&P 500 Sector/Consumer Staples), Materials Sector (S&P 500 Sector/Materials), Consumer Discretionary Sector (S&P 500 Sector/Consumer Discretionary), Health Care Sector (S&P 500 Sector/Health Care), Technology Sector (S&P 500 Sector/ Information Technology), Communication Services Sector (S&P 500 Sector/Comm. Services), Energy Sector (S&P 500 Sector/Energy), Short Term (Bloomberg Short Treasury), Intermediate-term (Bloomberg US Treasury), IG Corp (Bloomberg US Corp. Bond), High Yield (Bloomberg High Yield Corporate), Global Agg ex-US (Bloomberg Global Agg Ex US – Hedged).
Treasury Yields sourced from the U.S. Department of the Treasury.
Inflation (CPI) sourced from the U.S. Bureau of Labor Statistics.
1 Source: FactSet
2 Source: Hartford Funds
3 Source: Bloomberg
4 Source: Federal Reserve Board (median projection)
5 Source: Philadelphia Fed Recession Probability Index
The Consumer Price Index (CPI) examines the weighted average of prices of a basket of consumer goods and services, such as transportation, food and medical care and is a commonly used measure of the rate of inflation.
The Personal Consumption Expenditures (PCE) Index is the Fed’s preferred inflation gauge. It measures the prices that people living in the U.S. pay for goods and services. It’s known for capturing inflation across a wide range of consumer expenses.
Retail Sales represents the level of retail sales directly to U.S. consumers.
Durable Goods measure the cost of orders received by U.S. manufacturers of goods meant to last at least three years.
Fund Funds Rate: Short-term target interest rate set by the Federal Open Market Committee (FOMC); the policy making committee of the Federal Reserve. It is the interest that banks and other depository institutions lend money on an overnight basis.
S&P 500 Index: Index is generally considered representative of the stock market as a whole. The index focuses on the large-cap segment of the U.S. equities market.
Russell 2000 Index: Index measures performance of the small-cap segment of the U.S. equity universe.
MSCI EAFE Index: Index measures the performance of the large and mid-cap segments of developed markets, excluding the U.S. & Canada.
MSCI EM Index: Index Measures the performance of the large and mid-cap segments of emerging market equities.
Bloomberg US Aggregate Bond Index: Index measures the performance of investment grade, U.S. dollar-denominated, fixed-rate taxable bond market, including Treasuries, government-related and corporate securities, MBS, ABS, and CMBS.
Park Avenue Securities LLC (PAS) is a wholly owned subsidiary of The Guardian Life Insurance Company of America (Guardian). 10 Hudson Yards, New York, NY 10001. PAS is a registered broker-dealer offering competitive investment products, as well as a registered investment advisor offering financial planning and investment advisory services. PAS is a member of FINRA and SIPC.
PAS018143
7069921.1 (Exp. 09/26)