
Monthly Market Commentary - July 2024
Monthly Market Commentary - July 2024
Market Update
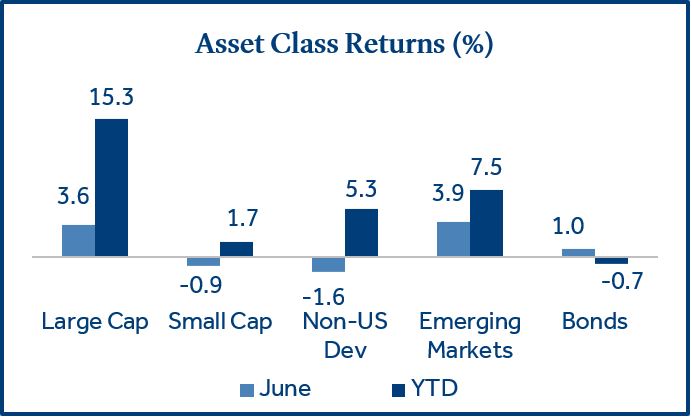
Asset classes post mixed returns led by U.S. large caps and emerging market stocks.
Equity returns were mixed in June following the broad rally in May. Softer than expected retail sales, jobless claims, and new construction data suggest the U.S. economy is still growing, but at a slower pace. Against this backdrop:
- Large cap stocks continued their climb: Large cap stocks (S&P 500 Index) gained +3.6% and outperformed small cap stocks (Russell 2000 Index) which returned -0.9%. Investors have gravitated to larger cap stocks as the Federal Reserve (the Fed) continued to scale back expectations for interest rate cuts due to stubborn inflation.
- Bonds posted positive returns in back-to-back months for first time in 2024: Bonds (Bloomberg US Aggregate Bond Index) returned +1.0% as Treasury yields moved lower. In June, the 10-year Treasury yield declined from 4.51% to 4.36% (-0.15%).
- Emerging Market (EM) stocks were led by tech: EM stocks (MSCI EM Index) returned +3.9% and outperformed non-U.S. developed market stocks (MSCI EAFE Index) which lost -1.6%. Technology stocks drove EM returns as it is the largest sector weight (23%) within the index (versus 10% for the MSCI EAFE), and EM Tech stocks gained +12.7% in June.
U.S. Equities
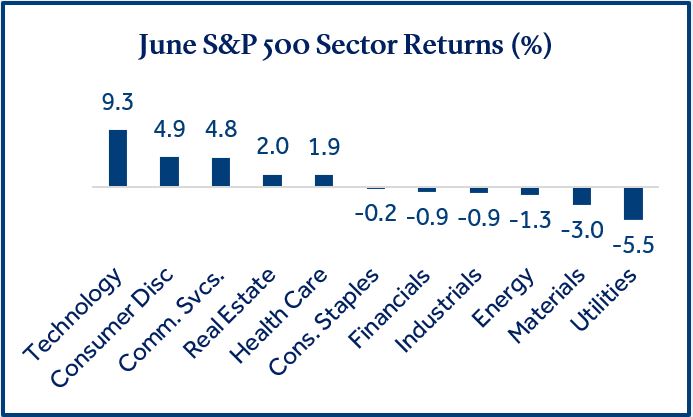
Mega cap technology stocks continued to lead broad indexes higher in June.
The strong performance in large caps continued to be driven by a small number of the largest U.S. technology-oriented stocks. The top six positions in the S&P 500 (NVIDIA, Microsoft, Apple, Amazon, Meta, and Alphabet) comprise 31% of the index weight and were responsible for most of the index return in June as the S&P 500 (+3.6%) outperformed the S&P 500 Equal Weighted Index (-0.5%).
- Large cap stocks outperformed small cap stocks: The performance gap between large cap and small cap stocks widened meaningfully in June. The spread between large and small cap stocks now sits at more than 13% (+15.3% versus +1.7%) for the year-to-date period.
- Technology was the top performing sector for the second consecutive month: Steady first quarter financial results and excitement about Artificial Intelligence (AI) buoyed returns. Semiconductor stocks continued to exhibit strength in June (+10%) as companies poured investments into their AI capabilities.
- NVIDA briefly becomes the world’s most valuable company: The market capitalization (or size) of NVIDIA surpassed Microsoft and Apple in June as it became the largest stock in the S&P 500 Index ($3.1 trillion). The supplier of video game and AI computer chips returned +13% in June and +149% year-to-date.
Fixed Income
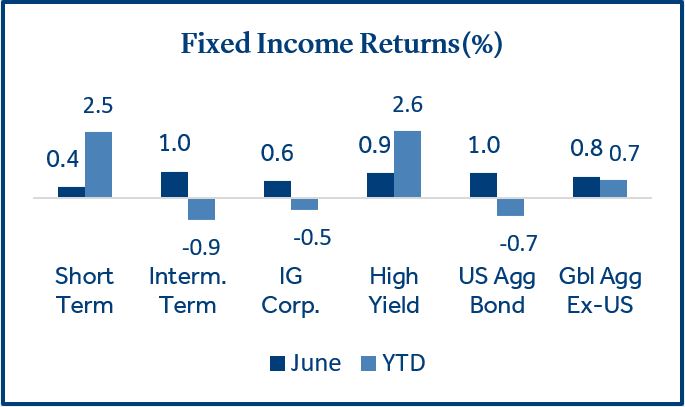
Fixed income asset classes benefitted from lower Treasury yields during the month.
Most fixed income assets struggled in early 2024 as Treasury yields moved steadily highly. However, concerns about slowing economic growth pushed yields lower in May and June.
- Long duration bonds outperformed short duration bonds as rates declined: Longer-term bonds outperformed short term bonds in June due to declining interest rates and lower inflation. A continuation of these themes could be supportive to intermediate and longer-term bonds moving forward.
- High yield bonds outperformed investment grade (IG) bonds: High yield bonds (rated BB and below) outperformed IG corporate bonds (rated AAA to BBB) in June and year-to-date as corporate fundamentals remained strong and spreads (the premium between corporate bond yields and Treasuries) have tightened. However, with credit spreads near 15-year lows and continued uncertainty around U.S. economic growth, we are monitoring for a shift to higher quality IG corporate bonds.
- Non-U.S. bonds outperformed U.S. bonds year-to-date: Global bonds have the potential to provide additional diversification to a fixed income portfolio. In the first half of 2024, non-U.S. bonds outperformed as many foreign countries have had inflation decline at a faster rate compared to the U.S., which has resulted in yields falling more quickly in those markets.
Real Estate
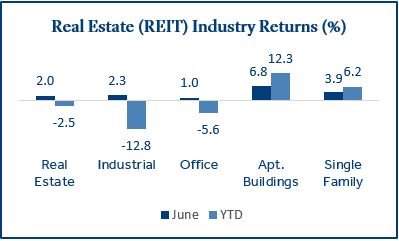
The real estate sector has been weak year-to-date with mixed underlying performance.
Real estate was the only sector in the S&P 500 Index that generated a negative return in the first half of the year. Higher interest rates and rising vacancies in certain real estate industries have weighed on the sector overall.
- Industrials and offices were challenged in the first half of 2024: Slower leasing demand and higher supply have weighed on industrial REIT returns year-to-date while higher interest rates and vacancies tied to remote work have weighed on the performance of office REITs . Potential warning signs in office have emerged as 30 large office buildings, located in major cities across the U.S., are in foreclosure, more than double the amount in early 20231.
- Residential sectors have remained steady on high demand and low supply: Residential REITs own and manage apartment buildings, single family homes, and student housing. With home prices near all-time highs and mortgage rates near 20-year highs (6.5% - 7%), owning a home is out of reach for many people. This has increased the demand for commercial housing as new supply waned during the extended period of low interest rates that preceded 2022 (as home ownership was more affordable).
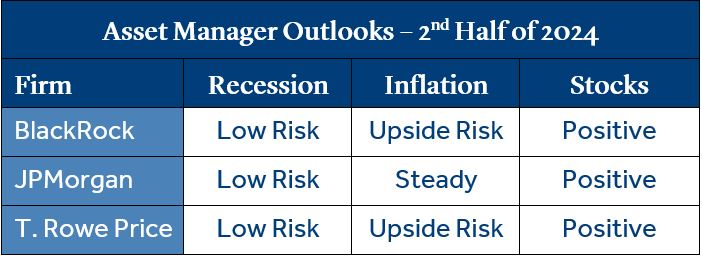
2024 Mid-Year Outlook
Asset managers expect a soft-landing for the U.S. economy and a cautious approach from the Fed.
Capital markets were broadly positive (led by large cap stocks) in the first half of the year despite uncertainty around U.S. corporate earnings growth, inflation, and central bank policy. Mid-year outlooks from several top asset managers have been released and the forecasts were positive.
- The U.S. is likely to avoid a recession in 2024: Continued wage growth and significant gains in wealth, due to rising equity markets and home values, has led to a resilient consumer which has supported GDP growth. Business spending has also been strong due to a rising appetite for AI-related technology.
- There may be only two rate cuts by year end: In early January, interest rate futures projected seven rate cuts in 2024 (versus two as of 6.30)2. However, the “last mile” to the Fed’s 2% inflation target has been bumpy. Most firms believe inflation will decline slowly through the end of the year but with risks skewed to the upside.
- Earnings growth should be supportive for equities: The consensus view was positive on equities for the second half of the year. The managers cited the likelihood of continued strength for domestic large cap and AI-related stocks which should be able to withstand the slower path to lower interest rates.
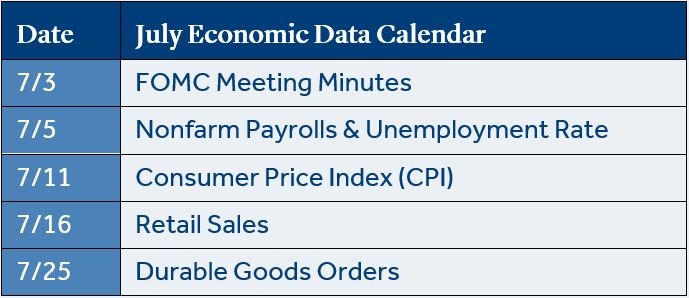
Economic Calendar
Continued strength in job growth and wages could delay rate cuts.
- The Fed held rates steady in June: The Fed acknowledged that modest progress was made against inflation, but they still did not have enough economic support to lower interest rates. Further, the committee revised its 2024 rate cut expectations to one (they previously expected three rate cuts in March). The futures market, which represents expectations from investors, is forecasting two rate cuts in 2024.
- May retail sales were weaker than expected: Retail sales increased +0.1% in May (+2.3% annualized) but were lower than the expected level of +0.3%. Consumers reined in spending during the month due to the effects of higher inflation. Further, April retail sales were revised down to -0.2% (from 0%).
- May job growth exceeded expectations: The U.S. added +272k new jobs during the month which far exceeded estimates (+190k) and new jobs added during the previous month (+165k). However, the unemployment rate rose to 4% (from 3.9%) for the first time since early 2022. Average hourly earnings, an inflation indicator, increased +4.1% (annualized) in May and were above estimates (+3.9%).
Click here to download the full report.
Data and rates used were indicative of market conditions as of the date shown. Opinions, estimates, forecasts, and statements of financial market trends are based on current market conditions and are subject to change without notice. This material is intended for general public use and is for educational purposes only. By providing this content, Park Avenue Securities LLC is not undertaking to provide any recommendations or investment advice regarding any specific account type, service, investment strategy or product to any specific individual or situation, or to otherwise act in any fiduciary or other capacity. Please contact a financial professional for guidance and information that is specific to your individual situation. Indices are unmanaged and one cannot invest directly in an index. Links to external sites are provided for your convenience in locating related information and services. Guardian, its subsidiaries, agents, and employees expressly disclaim any responsibility for and do not maintain, control, recommend, or endorse third-party sites, organizations, products, or services and make no representation as to the completeness, suitability, or quality thereof. Past performance is not a guarantee of future results.
Asset class returns sourced from Morningstar Direct. Asset categories listed correspond to the following underlying indices: Large Cap (S&P 500), U.S. Large Cap (S&P 500) Small Cap (Russell 2000), Non-US Dev (MSCI EAFE), Emerging Markets (MSCI EM), Bonds (Bloomberg US Aggregate Bond), Energy Sector (S&P 500 Sector/Energy), Utilities Sector (S&P 500 Sector/Utilities), Consumer Staples Sector (S&P 500 Sector/Consumer Staples), Industrials Sector (S&P 500 Sector/Industrials), Financials Sector (S&P 500 Sector/Financials), Communication Services Sector (S&P 500 Sector/Comm. Services), Materials Sector (S&P 500 Sector/Materials), Consumer Discretionary Sector (S&P 500 Sector/Consumer Discretionary), Health Care Sector (S&P 500 Sector/Health Care), Technology Sector (S&P 500 Sector/ Information Technology), Real Estate Sector (S&P 500 Sector/Real Estate), Short Term (Bloomberg Short Treasury), Intermediate-term (Bloomberg US Treasury), IG Corp (Bloomberg US Corp. Bond), High Yield (Bloomberg High Yield Corporate), Global Agg ex-US (Bloomberg Global Agg Ex US – Hedged), Apartments. (FTSE Nareit Equity Apartments), Single family (FTSE Nareit Equity Single Family Homes), Industrial (FTSE Nareit Equity Industrial), Office (FTSE Nareit Equity Office).
Treasury Yields sourced from the U.S. Department of the Treasury.
Inflation (CPI) sourced from the U.S. Bureau of Labor Statistics.
1 Source: Trepp
2 Source: CME FedWatch Tool
The Consumer Price Index (CPI) examines the weighted average of prices of a basket of consumer goods and services, such as transportation, food and medical care and is a commonly used measure of the rate of inflation.
Retail Sales represents the level of retail sales directly to U.S. consumers.
Durable Goods measure the cost of orders received by U.S. manufacturers of goods meant to last at least three years.
Fund Funds Rate: Short-term target interest rate set by the Federal Open Market Committee (FOMC); the policy making committee of the Federal Reserve. It’s the interest that banks and other depository institutions lend money on an overnight basis.
Real Estate Investment Trust (REIT): A security that trades like a stock on a major exchange which owns, and generally operates, income-producing real estate or related assets.
S&P 500 Index: Index is generally considered representative of the stock market as a whole. The index focuses on the large-cap segment of the U.S. equities market.
Russell 2000 Index: Index measures performance of the small-cap segment of the U.S. equity universe.
MSCI EAFE Index: Index measures the performance of the large and mid-cap segments of developed markets, excluding the U.S. & Canada.
MSCI EM Index: Index Measures the performance of the large and mid-cap segments of emerging market equities.
Bloomberg US Aggregate Bond Index: Index measures the performance of investment grade, U.S. dollar-denominated, fixed-rate taxable bond market, including Treasuries, government-related and corporate securities, MBS, ABS, and CMBS.
Park Avenue Securities LLC (PAS) is a wholly owned subsidiary of The Guardian Life Insurance Company of America (Guardian). 10 Hudson Yards, New York, NY 10001. PAS is a registered broker-dealer offering competitive investment products, as well as a registered investment advisor offering financial planning and investment advisory services. PAS is a member of FINRA and SIPC.
2024-177385 (Exp. 07/26)