
Monthly Market Commentary - July 2023
Monthly Market Commentary - July 2023
Market Update
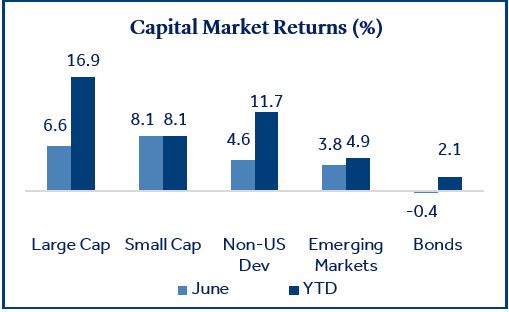
Major asset classes added to solid year-to-date gains.
Asset class returns were broadly positive in June as job growth remained strong, the Federal Reserve paused interest rate hikes, and inflation continued its downward trajectory. Against this backdrop, small-cap stocks (Russell 2000 Index) outperformed large-cap stocks (S&P 500 Index) as lower inflation and the hope of a soft landing for the U.S. economy could be a tailwind to smaller stocks. Bonds declined modestly during the month as intermediate and long-term yields inched higher. Lastly, Non-U.S. Developed stocks (MSCI EAFE Index) trailed domestic stocks due to growing concerns about slowing economic growth in Europe.
Federal Reserve
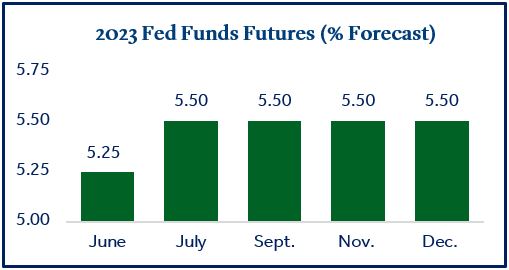
The Fed paused rate hikes for the first time during the current rate cycle.
The Federal Reserve left short-term lending rates unchanged in June as inflation continued to trend lower. The Consumer Price Index (CPI) has now declined eleven consecutive months since peaking at 9.1% in June 2022. Headline CPI for May registered 4.0% year over year, well below the prior month (4.9%), and the lowest annual increase in over two years1. Energy prices, especially gasoline, led the decline while the cost of shelter and dining out continued to rise.
Following the announcement, Fed Chair Jerome Powell's comments were mixed, leaving uncertainty about the future direction of rates. Although Powell noted the Fed's success battling inflation, he also indicated that their work was not done. The Fed's overall projection for the fed funds rate in December increased from the prior month, meaning several committee members still expect 1-2 additional hikes later in the year. The futures market currently forecasts a similar rise and is now "pricing in" one additional hike in 20232.
Yield Curve
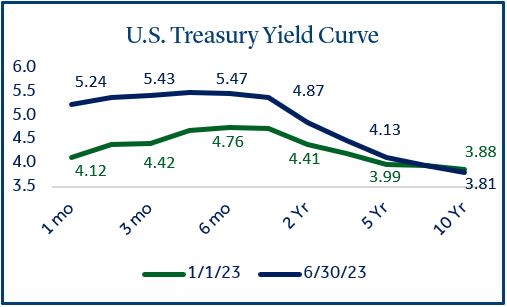
Short-term yields now exceed long-term yields by more than 100 basis points.
The inversion of the U.S. treasury curve continued to deepen throughout June. An inverted yield curve occurs when short-term rates rise above long-term rates, and this signal has preceded the last eight U.S. recessions3. The U.S. treasury yield curve has been inverted for nearly a year as the Fed has raised short-term interest rates ten times since March 2022. The chart below reflects the significant increase in short-term yields while long-term yields have remained relatively constant.
This data suggests investors may be pessimistic about the economy, as higher demand (lower yield) for longer-term bonds signals risk aversion. Further, an inverted yield curve can create a challenging profit environment for banks as they borrow at short-term rates and lend at long-term rates. As negative yield spreads widen, banks may tighten lending standards and further restrict economic growth.
U.S. Economy
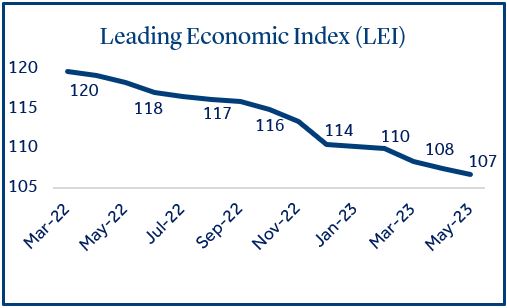
Recession pressures continue to build despite strong equity returns.
There continue to be mixed signals when sifting through economic data for signs of what lies ahead for the U.S. economy. Headwinds remain for U.S. GDP which has now declined in two consecutive quarters. The Leading Economic Index (LEI) declined in May for the 14th consecutive month and could point to weaker economic activity ahead. Individual components driving LEI lower included a decline in new orders from manufacturing firms, deteriorating consumer expectations, negative yield spreads, and tightening credit conditions. Other widely followed economic data such as retail sales, durable goods orders, and consumer sentiment have been inconsistent and haven’t established a meaningful trend up or down. Conversely, economic tailwinds include a resilient U.S. labor market that topped estimates and created over 300,000 new jobs in May, an unemployment rate (3.7%) that remains near 50-year lows, and Q1 2023 corporate earnings that largely exceeded estimates4.
Portfolio Diversification
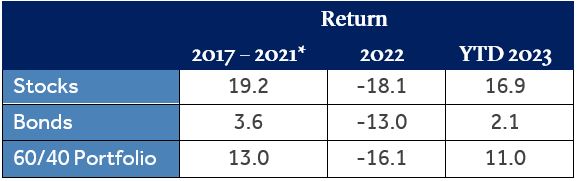
Traditional asset allocation returned to form in the first half of 2023.
Portfolio diversification could be top of mind for investors if the U.S. enters a recession. The 60/40 stock and bond portfolio5 has represented a traditional balanced investment allocation that provides capital appreciation from stocks and income and protection from bonds. This premise was put to the test last year as stocks and bonds did not provide the expected correlation benefits. During 2022, the 60/40 portfolio declined 16% and delivered one of its worst years on record. As such, some investors have declared the investment strategy dead and outdated.
However, it’s important to remember that 2022 was somewhat of an outlier as stocks and bonds both experienced significant losses when the Fed embarked on its most aggressive rate hike campaign in 50 years. As we reach the midpoint of 2023, the 60/40 portfolio has steadily recovered with an +11% return year to date. Although the 60/40 portfolio is much too simplistic for most investors, its resurgence is a good reminder to stay true to your long-term objectives and strategic asset allocation even during times of market stress and volatility.
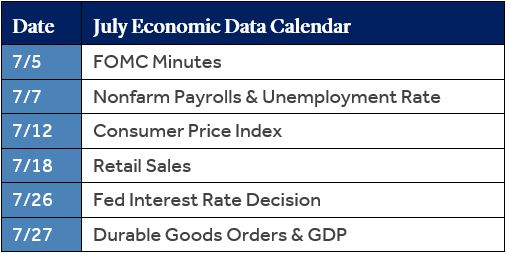
Economic Calendar
Economic data releases will pick up in mid-July.
Nonfarm payrolls and unemployment will be highly scrutinized by investors early in the month as a strong labor market is crucial for the U.S. economy to achieve a soft landing and avoid a recession.
The Consumer Price Index (CPI) in mid-July will likely be a key determinant in the direction of near-term monetary policy. Although CPI continues to decline it remains well above the Fed’s long-term target of 2%. Another meaningful decline in CPI may provide the Fed flexibility to remain on “pause” and allow the economy additional time to digest previous hikes. However, if the trend in CPI reverses, the Fed could quickly re-embark on their rate hike campaign to keep momentum in their battle against inflation.
Data and rates used were indicative of market conditions as of the date shown. Opinions, estimates, forecasts, and statements of financial market trends are based on current market conditions and are subject to change without notice. This material is intended for general public use and is for educational purposes only. By providing this content, Park Avenue Securities LLC is not undertaking to provide any recommendations or investment advice regarding any specific account type, service, investment strategy or product to any specific individual or situation, or to otherwise act in any fiduciary or other capacity. Please contact a financial professional for guidance and information that is specific to your individual situation. Indices are unmanaged and one cannot invest directly in an index. Links to external sites are provided for your convenience in locating related information and services. Guardian, its subsidiaries, agents, and employees expressly disclaim any responsibility for and do not maintain, control, recommend, or endorse third-party sites, organizations, products, or services and make no representation as to the completeness, suitability, or quality thereof. Past performance is not a guarantee of future results.
Capital Market Return data sourced from Morningstar Direct. Asset categories listed correspond to the following underlying indices: Large-cap (S&P 500), Growth Stocks (Russell 1000 Growth), Value Stocks (Russell 1000 Value), small-cap (Russell 2000), Small Growth (Russell 2000 Growth), Small Value (Russell 2000 Value), Non-US Dev (MSCI EAFE), Emerging Markets (MSCI EM), Bonds (Bloomberg US Aggregate Bond).
1 Source: Bureau of Labor Statistics
2 Source: CME FedWatch Tool
3 Source: Federal Reserve Bank of Cleveland
4 Source: FactSet
5 60/40 stock and bond portfolio: Performance data was calculated using the S&P 500 Index (60%) and Bloomberg US Aggregate Bond Index (40%). Indices are uninvestable.
The Leading Economic Index is designed to provide early indication of significant turning points in the business cycle and where the U.S. economy is heading in the near term.
Durable Goods, Retail Sales, Nonfarm Payrolls, and unemployment rate data sourced from Trading Economics.
Durable Goods measure the cost of orders received by U.S. manufacturers of goods meant to last at least three years.
Retail Sales represents the level of retail sales directly to U.S. consumers.
The Consumer Price Index (CPI) examines the weighted average of prices of a basket of consumer goods and services, such as transportation, food and medical care and is a commonly used measure of the rate of inflation.
Fund Funds Rate: Short-term target interest rate set by the Federal Open Market Committee (FOMC); the policy making committee of the Federal Reserve. It’s the interest that banks and other depository institutions lend money on an overnight basis.
S&P 500 Index: Index is generally considered representative of the stock market as a whole. The index focuses on the large-cap segment of the U.S. equities market.
Russell 2000 Index: Index measures performance of the small-cap segment of the U.S. equity universe.
MSCI EAFE Index: Index measures the performance of the large and mid-cap segments of developed markets, excluding the U.S. & Canada.
MSCI EM Index: Index Measures the performance of the large and mid-cap segments of emerging market equities.
Bloomberg U.S. Aggregate Bond Index: Index measures the performance of investment grade, U.S. dollar- denominated, fixed-rate taxable bond market, including Treasuries, government-related and corporate securities, MBS, ABS, and CMBS.
Park Avenue Securities LLC (PAS) is a wholly owned subsidiary of The Guardian Life Insurance Company of America (Guardian). PAS is a registered broker-dealer offering competitive investment products, as well as a registered investment advisor offering financial planning and investment advisory services. PAS is a member of FINRA and SIPC.
2023-157816 (Exp. 6/25)