
Monthly Market Commentary – February 2025
Monthly Market Commentary – February 2025
Market Update
Global stocks posted positive returns to start the year.
The S&P 500 Index touched a new all-time high in late January before retreating modestly into month end. As expected, the Federal Reserve (Fed) left short-term interest rates unchanged and lowered expectations for future interest rate cuts during their January policy meeting. Against this backdrop:
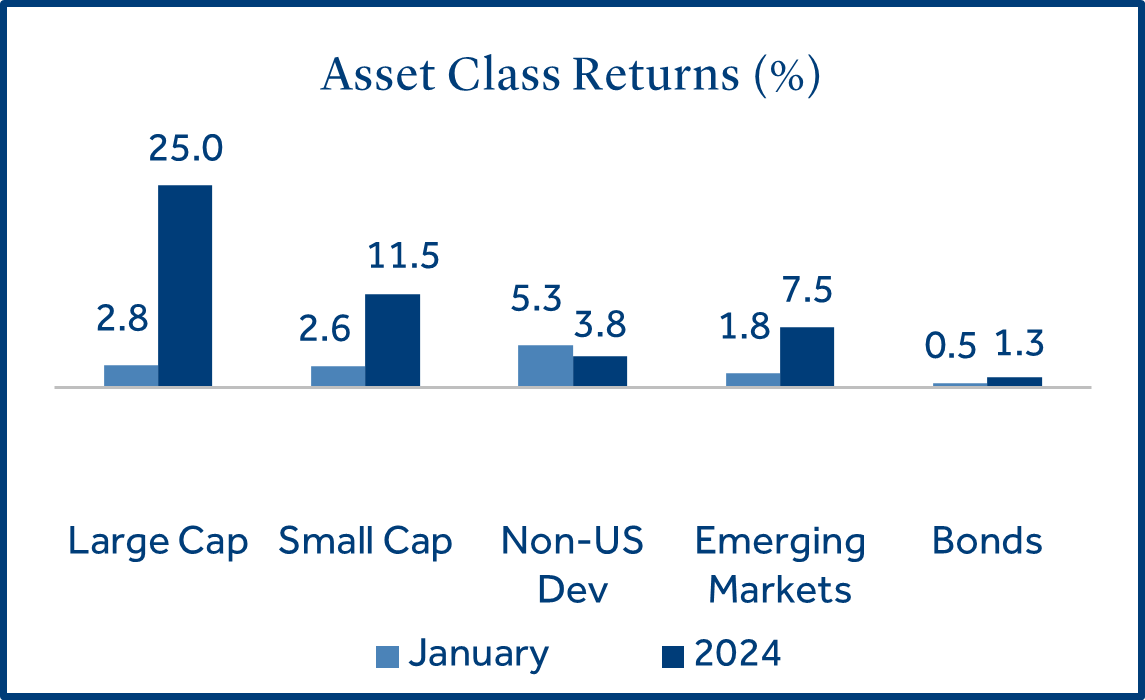
- Large caps outperformed small caps on strong bank earnings: Large cap stocks (S&P 500 Index) gained +2.8% during the month and outperformed small cap stocks (Russell 2000 Index) which returned +2.6%. Large cap stocks edged out smaller stocks partly due to strong corporate earnings from the financial sector.
- Bonds posted positive returns as long-term rates held steady: Bonds (Bloomberg US Aggregate Bond Index) returned +0.50% as the 10-year U.S. Treasury yield held steady in January at 4.58%.
- Non-U.S. developed markets outperformed emerging markets as interest rates eased: Non-U.S. developed markets (MSCI EAFE Index) returned +5.3% and topped emerging markets (MSCI EM Index) which gained +1.8%. Non-U.S. developed stocks benefitted from the European Central Bank’s fifth rate cut since June as inflation concerns continued to ease.
U.S. Equities
Stocks rose in January on solid U.S. economic data and a positive start to corporate earnings season.
Stocks posted positive returns as strength in the labor market and a strong U.S. consumer continued to be supportive of economic growth. Additionally, optimism over the trajectory of corporate profits boosted equities.
- Recent economic results have exceeded estimates: The Citi Economic Surprise Index measures the difference between realized and forecast economic results. The index has been steadily rising since September, indicating U.S. growth has been outperforming expectations.
- Fourth quarter earnings are off to a solid start: At this early stage (180 S&P 500 firms reported), 77% have reported earnings per share above estimates, ahead of the 10-year average (75%). 63% of firms topped revenue forecasts, slightly below the 10-year average (64%). Financials have reported the strongest year over year earnings growth of any sector 1.
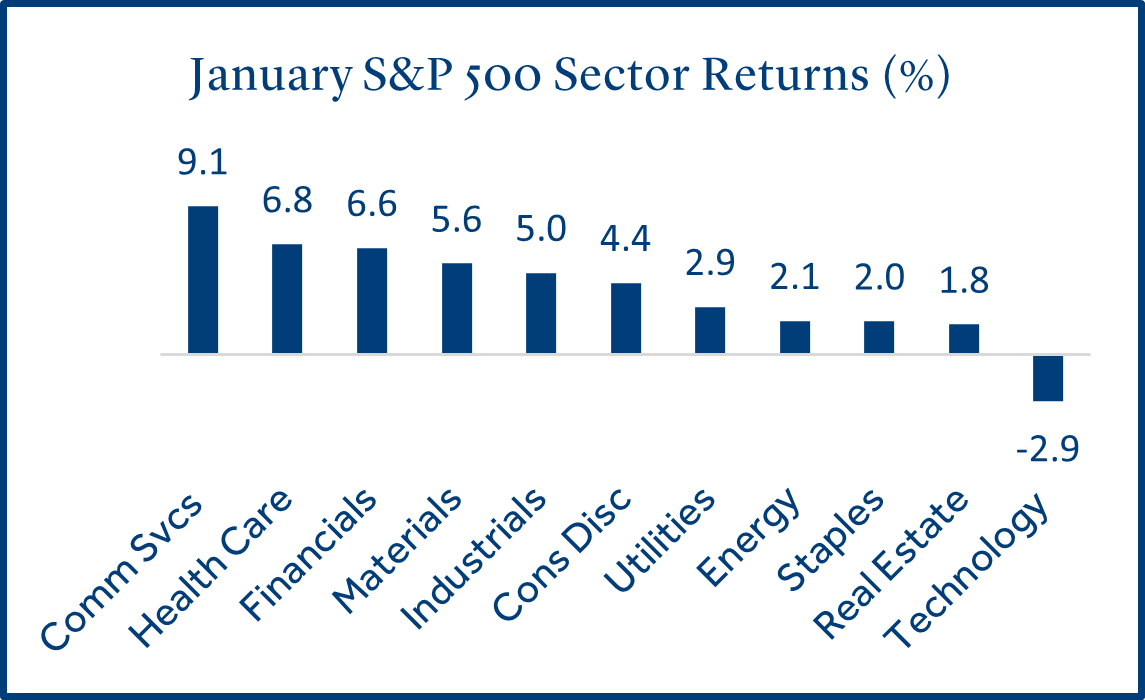
- The tech sector lagged as advances in China AI (artificial intelligence) jolted stocks: Large cap tech stocks declined sharply (-5.6%) on January 27 as Chinese AI firm DeepSeek unveiled an efficient and cost effective version of current AI technology. This caused a ripple across stocks like NVIDIA that produce high powered chips used for AI processing.
Fixed Income
Bond returns were mostly positive as investor demand for fixed income assets improved.
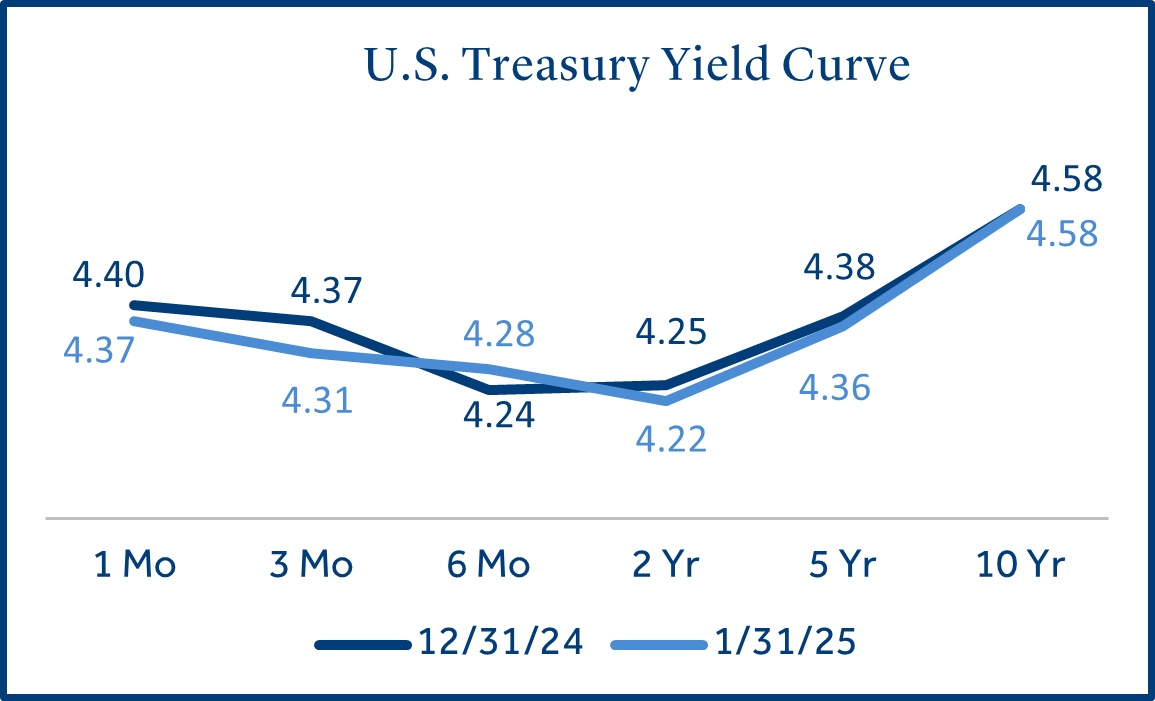
A steep rise in yields for intermediate-term and long-term treasuries in late 2024 have increased demand for bonds in 2025.
- Longer-term bonds outgained short-term bonds as yields settled: The Treasury yield curve was relatively unchanged during the month. Longer-term rates held steady on uncertainty around U.S economic policy and the Fed’s less confident view of the future direction of inflation.
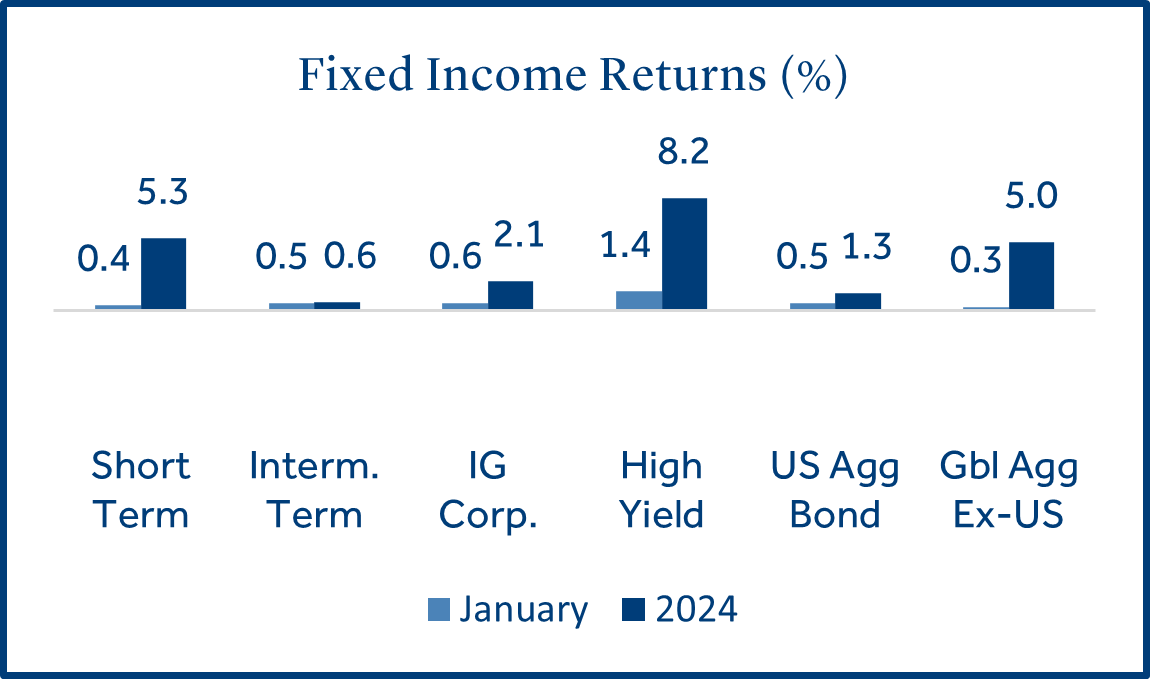
- High Yield (HY) outperformed investment grade (IG) bonds: HY bonds (rated BB and below) gained +1.4% versus +0.6% for IG bonds (rated BBB and above). HY bonds continued to outperform higher quality bonds and as a result HY yield premiums reached their lowest level since 20072. This could be a sign that investor risk taking has reached an elevated level.
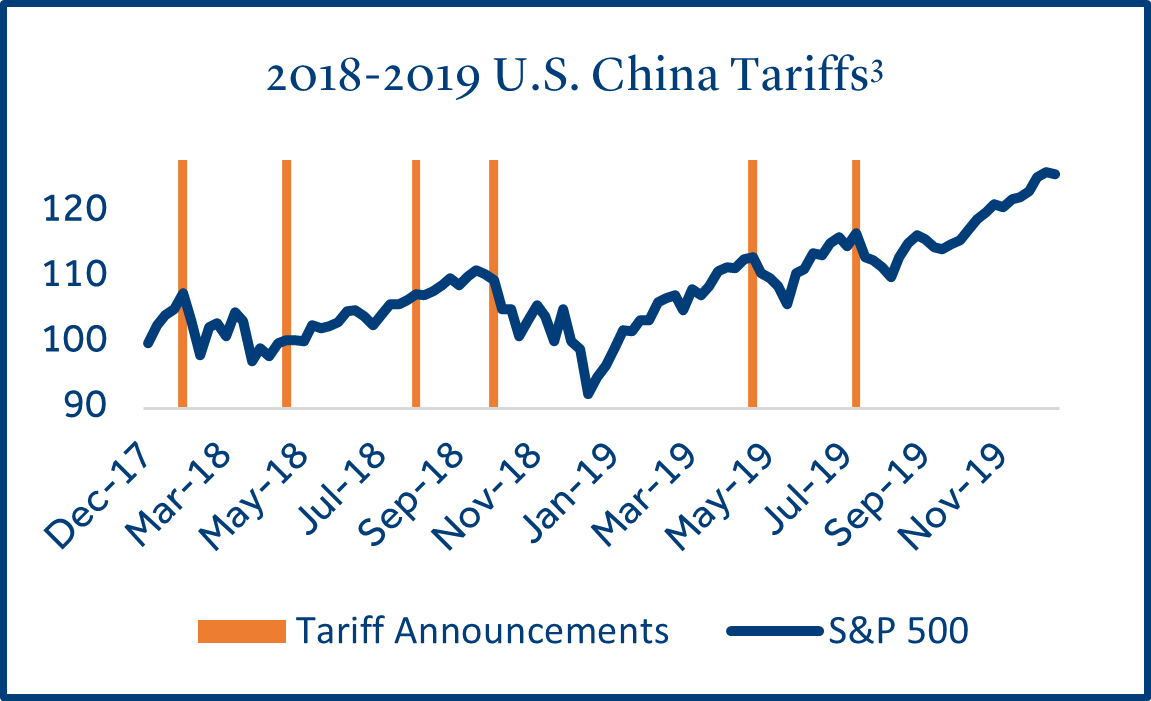
Tariffs
The new presidential administration levied tariffs on Canada, Mexico, and China.
The President announced plans to “take action to hold Mexico, Canada, and China accountable to their promises of halting illegal immigration and drug flow into the United States” by enacting taxes on imports.
- Tariffs are taxes imposed by governments on imported goods: Tariffs are designed to protect domestic industries, generate revenue, or influence trade partners. They are applied as a percentage of an imported product’s value or as a fixed fee per unit. Tariffs have the potential to lower profits for U.S. producers and increase the cost of goods for U.S. consumers.
- U.S. enacts 25% tariff on Mexico and Canada and 10% tariff on China: The effective dates for the announced tariffs are fluid. Each were initially scheduled to take effect February 4. However, it was announced on February 3 that tariffs on Mexico and Canada will be delayed for one month as negotiations have improved. Mexico, Canada, and China accounted for 42% of total U.S. imports in 2024 and goods that could be affected in the U.S. include food, gasoline, cars, steel, and lumber.
- 2018 and 2019 tariff enactments led to short-term volatility: Investors may be concerned that higher import prices could rekindle inflation, which may lead to increased market volatility. Immediately following the 2018 and 2019 tariffs, U.S. equities did experience modest declines, before recovering in subsequent months.
Federal Reserve
The Fed left short-term rates unchanged at their January policy meeting.
The continued strength of the U.S. economy and persistent inflation provided a backdrop for the Fed to be patient as it relates to their next policy move.
- As expected, the Fed left short-term rates unchanged at the January policy meeting: Interest rate futures accurately predicted the Fed would leave rates unchangedin January4. Comments from Fed Chair Powell indicated a somewhat more optimistic view of the labor market but a more pessimistic view on inflation, stating “inflation continued to remain somewhat elevated”.
- Rates may head lower, but the timing is unclear: The Fed has stated they will be data dependent in 2025 as the labor market has remained “solid”, while inflation has proved more stubborn than expected. Interest rate futures are currently projecting two rate cuts in 2025. There is a 50% probability that the first cut will come in May with the second cut likely to follow in September or October4.
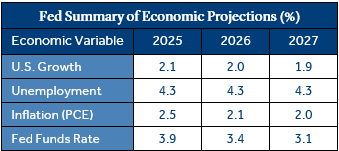
- The Fed raised their inflation forecast: The most notable change to the Fed’s economic outlook for 2025 (released in December) was higher inflation (measured by PCE). The Fed raised their estimate from +2.1% to +2.5% for 2025. If this forecast becomes reality, future rate cuts could underperform current market expectations.
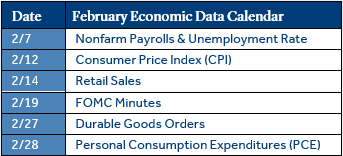
Economic Calendar
U.S. Job growth and consumer spending remained strong, but inflation continued to be stubborn.
The U.S. economy remained on solid footing to end 2024 as fourth quarter gross domestic product (GDP) grew by 2.3% (annualized), driven by as strong labor market and healthy consumer spending.
- U.S. job growth remained strong: +256k new jobs were created in December, compared to a forecast for +155k. Over +200k new jobs have been created in three out of the last four months, which is well above the pace needed to keep the unemployment rate stable (typically estimated at +70k to +90k new jobs per month). Continued strength in the labor market would likely provide the Fed with less incentive to cut rates for the time being.
- Retail sales continued to support economic growth: December retail sales rose +0.4% but missed forecasts (+0.6%). However, the key takeaway is that U.S. consumers remained resilient as retail sales have expanded for four consecutive months and increased +3.9% year over year. This pace of growth could bode well near-term for the U.S. economy as consumer spending accounts for two-thirds of GDP.
- CPI inflation continued to be stubborn: Price increases met forecasts in December (+2.9% annualized) but the lack of an upside surprise may have provided investors with relief. Since bottoming in September at +2.4% annualized, inflation has crept higher for three consecutive months. This steady march higher in inflation was likely a driver behind the rise in long-term Treasury yields during the fourth quarter.
Data and rates used were indicative of market conditions as of the date shown. Opinions, estimates, forecasts, and statements of financial market trends are based on current market conditions and are subject to change without notice. This material is intended for general public use and is for educational purposes only. By providing this content, Park Avenue Securities LLC is not undertaking to provide any recommendations or investment advice regarding any specific account type, service, investment strategy or product to any specific individual or situation, or to otherwise act in any fiduciary or other capacity. Please contact a financial professional for guidance and information that is specific to your individual situation. Indices are unmanaged and one cannot invest directly in an index. Links to external sites are provided for your convenience in locating related information and services. Guardian, its subsidiaries, agents, and employees expressly disclaim any responsibility for and do not maintain, control, recommend, or endorse third-party sites, organizations, products, or services and make no representation as to the completeness, suitability, or quality thereof. Past performance is not a guarantee of future results.
All investments involve risks, including possible loss of principal. Equities may decline in value due to both real and perceived general market, economic, and industry conditions. Fixed income securities involve interest rate, credit, inflation, and reinvestment risks, and possible loss of principal. As interest rates rise, the value of fixed income securities falls. Low-rated, high yield bonds are subject to greater price volatility. Investing in securities of smaller companies tends to be more volatile and less liquid than securities of larger companies. Investing in foreign securities may involve heightened risk including currency fluctuations, less liquid trading markets, greater price volatility, political and economic instability, less publicly available information and changes in tax or currency laws. Such risks are enhanced in emerging markets.
Asset class returns sourced from Morningstar Direct. Asset categories listed correspond to the following underlying indices: Large Cap (S&P 500), Small Cap (Russell 2000), Non-US Dev (MSCI EAFE), Emerging Markets (MSCI EM), Bonds (Bloomberg US Aggregate Bond), Short Term (Bloomberg Short Treasury), Intermediate-term (Bloomberg US Treasury), IG Corp (Bloomberg US Corp. Bond), High Yield (Bloomberg High Yield Corporate), Global Agg ex-US (Bloomberg Global Agg Ex US – Hedged), Growth (Russell 1000 Growth), Value (Russell 1000 Value).
Treasury Yields sourced from the U.S. Department of the Treasury.
Inflation (CPI) sourced from the U.S. Bureau of Labor Statistics.
1 Source: FactSet
2 Source: Federal Reserve Bank of St. Louis
3 Source: Reuters
4 Source: CME FedWatch Tool
The Consumer Price Index (CPI) examines the weighted average of prices of a basket of consumer goods and services, such as transportation, food and medical care and is a commonly used measure of the rate of inflation.
Retail Sales represents the level of retail sales directly to U.S. consumers.
Durable Goods measure the cost of orders received by U.S. manufacturers of goods meant to last at least three years.
Fed Funds Rate: Short-term target interest rate set by the Federal Open Market Committee (FOMC); the policy making committee of the Federal Reserve. It is the interest that banks and other depository institutions lend money on an overnight basis.
S&P 500 Index: Index is generally considered representative of the stock market as a whole. The index focuses on the large-cap segment of the U.S. equities market.
Russell 2000 Index: Index measures performance of the small-cap segment of the U.S. equity universe.
MSCI EAFE Index: Index measures the performance of the large and mid-cap segments of developed markets, excluding the U.S. & Canada.
MSCI EM Index: Index Measures the performance of the large and mid-cap segments of emerging market equities.
Bloomberg US Aggregate Bond Index: Index measures the performance of investment grade, U.S. dollar-denominated, fixed-rate taxable bond market, including Treasuries, government-related and corporate securities, MBS, ABS, and CMBS.
Park Avenue Securities LLC (PAS) is a wholly owned subsidiary of The Guardian Life Insurance Company of America (Guardian). 10 Hudson Yards, New York, NY 10001. PAS is a registered broker-dealer offering competitive investment products, as well as a registered investment advisor offering financial planning and investment advisory services. PAS is a member of FINRA and SIPC.
PAS018129
2024-7069921.7 (Exp. 12/26)