
Monthly Market Commentary - December 2023
Monthly Market Commentary - December 2023
Market Update
Stocks and bonds rallied broadly in November following three consecutive monthly declines.
Equity and fixed income returns were mostly positive across the spectrum in November as the price of oil declined, the Fed held rates steady, and longer-term Treasury yields retreated from recent highs. In addition, a strong finish to the third-quarter corporate earnings season helped fuel a strong month for equities.
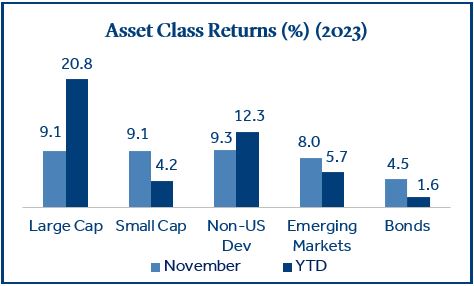
- Domestic large-cap stocks (S&P 500 Index) and small-cap stocks (Russell 2000 Index) posted similar returns (+9.1%), as breadth across equities improved in November.
- Bonds posted their strongest month of the year (+4.5%) and put an end to their streak of six consecutive monthly declines.
- Emerging Markets equities (MSCI EM Index) returned +8.0%, but underperformed non-U.S. developed (MSCI EAFE Index) stocks (+9.3%) as the economic recovery in China remained challenged.
During November, U.S. and non-U.S. developed market equities recovered much of the losses suffered over the past three months and major indices ended the month near 2023 highs.
U.S. Stocks
Technology stocks led domestic equities higher as the S&P 500 posted its best monthly return since mid-2022.
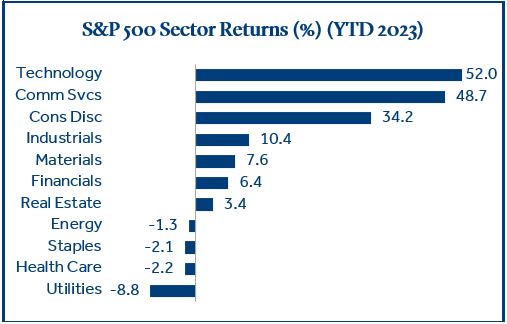
The Technology sector continued to pull major indices higher in a year where performance differences across sectors have been meaningful.
- Large cap tech stocks have outperformed despite higher interest rates, likely due to their balance sheet flexibility, large cash positions, and positive free cash flow. Communication Services also outperformed, driven mostly by Alphabet (Google parent) and Meta (formerly Facebook), both widely considered technology stocks that were reclassified as Communication Services due to their media presence.
- Financials lagged for most of 2023 following the regional banking crisis earlier this year. It was encouraging to see the sector rebound in November and return +10.9%, especially smaller regional banks which returned +15.6%, which helped to boost small cap indices.
- Energy, the top performing sector in 2022, has struggled year-to-date and was the only sector to post a negative return in November (-1.0%). Declining oil prices and fear of a recession were headwinds to these highly cyclical stocks.
The performance divergence in 2023 across equity sectors is a good reminder of the importance of a diversified portfolio.
Non-U.S. Stocks
When will the tide turn for non-U.S. stocks?
Non-U.S. stocks, in both developed and emerging markets (EM), rallied alongside U.S. stocks in November but have underperformed their U.S. counterparts in the year-to-date and 10-year period ending November 30:
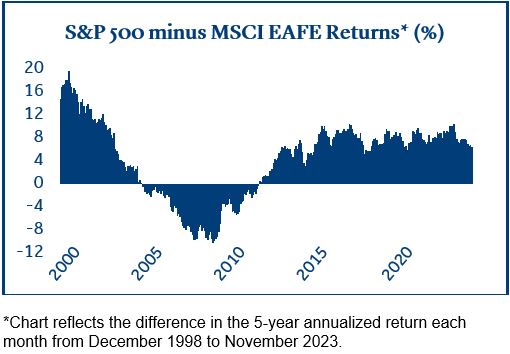
- Non-U.S. developed stocks (MSCI EAFE Index) underperformed U.S. stocks (S&P 500 Index) by 8.5% YTD. This is a continuation of the recent trend, as the MSCI EAFE trailed the S&P 500 by an average of 7.9%, annualized, over the most recent 10-year period.
- The performance spread is wider for EM, as the MSCI EM Index trailed the S&P 500 by an average of 9.7%, annualized, during the same period.
- From a price-to-earnings (P/E) perspective, non-U.S. stocks became less expensive relative to U.S. stocks during these 10 years. The P/E ratio for the MSCI EAFE declined from 15.4 to 12.7 while it increased for the S&P 500 from 18.6 to 20.81. The current spread in P/E ratio for the indices (8.1) is well above the 10-year average (4.9)1.
Relative performance between domestic and international equities can be cyclical as reflected in the chart below. Valuation conscious investors seeking additional diversification may want to review their allocation to non-U.S. stocks.
Corporate Earnings
Third-quarter earnings per share for S&P 500 companies were above long-term averages.
Corporate profits continue to be resilient in an economic environment that has provided mixed signals. 94% of S&P 500 companies have reported financial results for the third quarter:
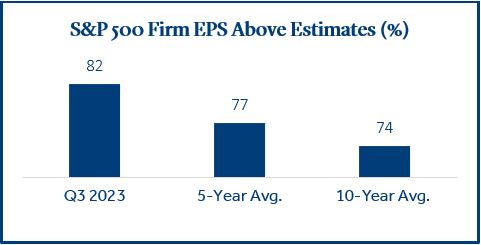
- 82% of firms reported earnings per share (EPS) that exceeded analyst estimates, which is above the five- and ten-year averages of 77% and 74%, respectively. On average, EPS was 7.1% above estimates, which is below the five-year average (+8.5%) but above the ten-year average (+6.6%)2.
- 62% of firms reported revenue above consensus estimates, which is below the five- and 10-year average of 68% and 64%, respectively2.
- Eight of eleven S&P 500 sectors reported year-over-year earnings growth, led by the Communication Services, Consumer Discretionary, and Financials sectors. The Energy, Materials, and Health Care sectors each reported earnings declines.
A key takeaway from third quarter earnings calls was the decreased focus on inflation. CPI (+3.2%) has continued to trend lower and fewer firms cited inflation as a potential headwind. 59% of S&P 500 firms mentioned inflation when reporting financial results, which was the lowest level since the second quarter of 2021, and the fifth consecutive quarterly decline2.
Federal Reserve
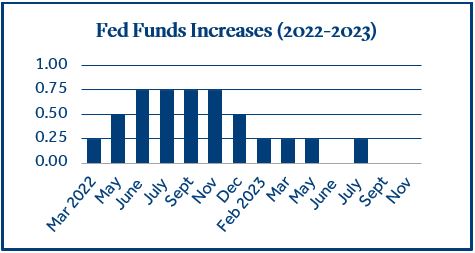
The futures market is forecasting the Fed to leave rates unchanged during their December meeting.
Fed Funds futures are forecasting a 99% chance the short-term lending rate will remain unchanged in December3, which would be the case for the third consecutive meeting. There are several potential drivers to the Fed’s recent pause in rate increases:
- Inflation has continued to trend lower with the Fed projecting headline inflation will decline to 2.5% in the fourth quarter of 20244.
- Longer-term Treasury yields declined in November, but the 10-year yield (4.37%) remains 66 basis points higher than in late June. This increase could provide added support to current Fed Policy as it generally translates to higher borrowing costs for the government, corporations, and consumers.
- Although gross domestic product (GDP) and the U.S. labor market remain strong, the Fed stated at their November meeting that U.S. economic growth has moderated, and credit conditions have tightened.
The Fed was aggressive in their pursuit of lower inflation as evidenced in the chart below. However, the economy has yet to absorb the full effect of these rate hikes and the Fed appears to be conscious of tightness in certain areas of the market.
A reasonable conclusion could be that we are near the end of the rate hike cycle and in an environment where rates may stay elevated for some time.
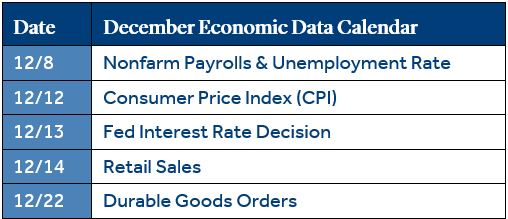
Economic Calendar
Mid-December will be in focus as CPI (inflation), a Fed rate decision, and retail sales fall on consecutive days.
It is an unusually slow start to the month from an economic data perspective, but things will pick up quickly mid-month.
- Nonfarm payrolls are up first, and investors will be looking for the effect of higher rates on the labor market. September results (297k jobs added) were well above estimates (170k) but that reversed in October (150k) as new jobs missed expectations (180k)5.
- CPI always has the potential to move markets as any meaningful increase could be a catalyst to further Fed rate hikes. Headline CPI declined from 3.7% to 3.2%, annualized, in October6.
- As previously discussed, the futures market indicates a low probability of a rate change during this month’s Fed meeting. However, any change in the Fed’s post-decision statement regarding future policy and the U.S economy will be heavily scrutinized.
Strength in the labor market and a continued downward trajectory in CPI could provide support to the recent rally in stocks and bonds. If long-term interest rates and the geopolitical environment remain stable, it could pave the way for a strong close to 2023.
Data and rates used were indicative of market conditions as of the date shown. Opinions, estimates, forecasts, and statements of financial market trends are based on current market conditions and are subject to change without notice. This material is intended for general public use and is for educational purposes only. By providing this content, Park Avenue Securities LLC is not undertaking to provide any recommendations or investment advice regarding any specific account type, service, investment strategy or product to any specific individual or situation, or to otherwise act in any fiduciary or other capacity. Please contact a financial professional for guidance and information that is specific to your individual situation. Indices are unmanaged and one cannot invest directly in an index. Links to external sites are provided for your convenience in locating related information and services. Guardian, its subsidiaries, agents, and employees expressly disclaim any responsibility for and do not maintain, control, recommend, or endorse third-party sites, organizations, products, or services and make no representation as to the completeness, suitability, or quality thereof. Past performance is not a guarantee of future results.
Asset class returns and sector returns sourced from Morningstar Direct. Asset categories listed correspond to the following underlying indices: Large-cap (S&P 500), Small-cap (Russell 2000), Non-US Dev (MSCI EAFE), Emerging Markets (MSCI EM), Bonds (Bloomberg US Aggregate Bond) Regional Banks (S&P Sub/Regional Banks).
Treasury Yields sourced from the U.S. Department of the Treasury.
Fed Funds increases sourced from the Federal Reserve.
1 Source: Morningstar Direct
2 Source: FactSet
3 Source: CME FedWatch Tool
4 Source: Federal Reserve
5 Source: Trading Economics
6 Source: U.S. Bureau of Labor Statistics
Durable Goods measure the cost of orders received by U.S. manufacturers of goods meant to last at least three years.
Retail Sales represents the level of retail sales directly to U.S. consumers.
The Consumer Price Index (CPI) examines the weighted average of prices of a basket of consumer goods and services, such as transportation, food and medical care and is a commonly used measure of the rate of inflation.
Fund Funds Rate: Short-term target interest rate set by the Federal Open Market Committee (FOMC); the policy making committee of the Federal Reserve. It’s the interest that banks and other depository institutions lend money on an overnight basis.
S&P 500 Index: Index is generally considered representative of the stock market as a whole. The index focuses on the large-cap segment of the U.S. equities market.
Russell 2000 Index: Index measures performance of the small-cap segment of the U.S. equity universe.
MSCI EAFE Index: Index measures the performance of the large and mid-cap segments of developed markets, excluding the U.S. & Canada.
MSCI EM Index: Index Measures the performance of the large and mid-cap segments of emerging market equities.
Bloomberg U.S. Aggregate Bond Index: Index measures the performance of investment grade, U.S. dollar-denominated, fixed-rate taxable bond market, including Treasuries, government-related and corporate securities, MBS, ABS, and CMBS.
Park Avenue Securities LLC (PAS) is a wholly owned subsidiary of The Guardian Life Insurance Company of America (Guardian). PAS is a registered broker-dealer offering competitive investment products, as well as a registered investment advisor offering financial planning and investment advisory services. PAS is a member of FINRA and SIPC.
2023-165524 (Exp. 11/25)