
Monthly Market Commentary – April 2025
Monthly Market Commentary – April 2025
Market Update
International stocks and U.S. bonds outperformed amid weak asset class returns in March.
The S&P 500 Index entered a correction in mid-March as it declined -10% from its February 19th high. Slowing economic growth, stubborn inflation, and policy uncertainty all contributed to the decline. The Federal Reserve (Fed) left short-term rates unchanged and Treasury yields were range bound during the month. Against this backdrop:
-
U.S. stocks underperformed on economic growth concerns: Large cap stocks (S&P 500 Index) declined -5.6% but outperformed small caps (Russell 2000 Index) which lost -6.8%. A downward revision to GDP, tariff uncertainty, and weakening job growth were headwinds to domestic stock returns.
-
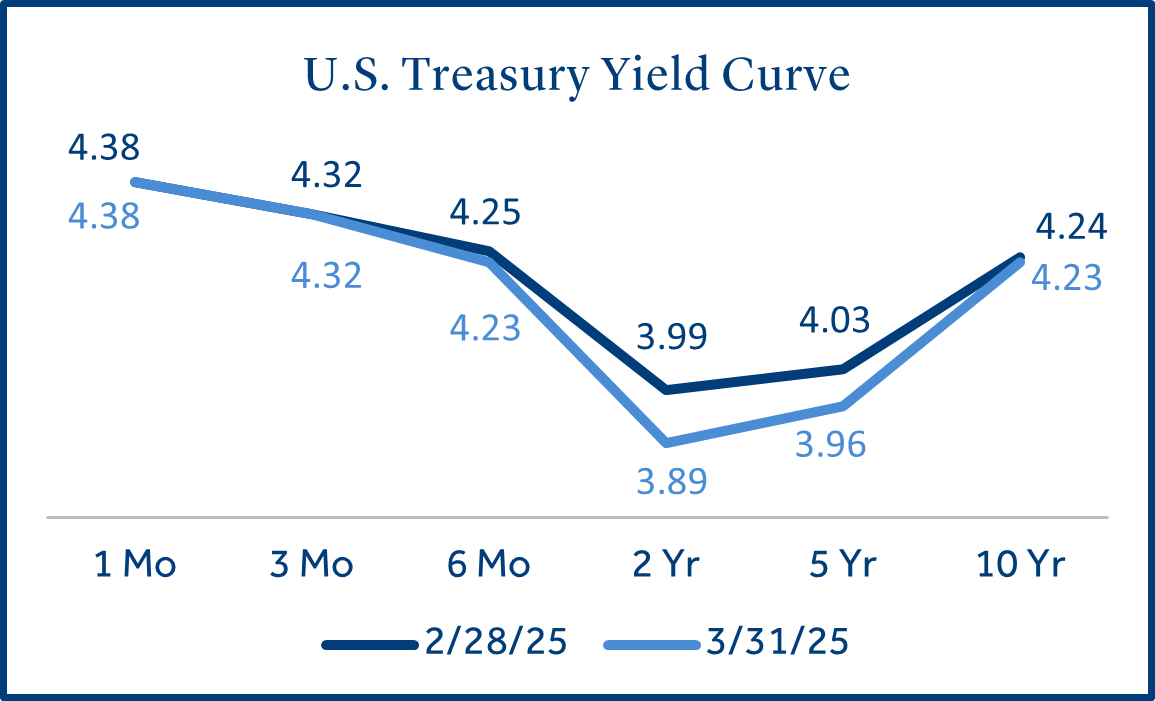
Bond returns were flat as Treasury yields were modestly lower during the month: Bonds (Bloomberg US Aggregate Bond Index) returned 0% as the 10-year U.S. Treasury yield dipped from 4.24% to 4.23% (-0.01%).
-
International stocks continued to lead asset class returns year-to-date: Emerging market stocks (MSCI EM Index) gained +0.6% and outperformed developed markets (MSCI EAFE Index) which lost -0.4%. Indian stocks (+9.4%) drove EM returns as inflation reached a seven month low. Non-U.S. stocks outperformed U.S. stocks by +11.2% in the first quarter, which was the widest gap since 20021.

Equities
Large cap technology companies continued to be a drag on U.S. stock returns.
International stocks have outperformed U.S. stocks for four consecutive months dating back to last December. This is only the second time a streak of that length has occurred over the last ten years1.
-
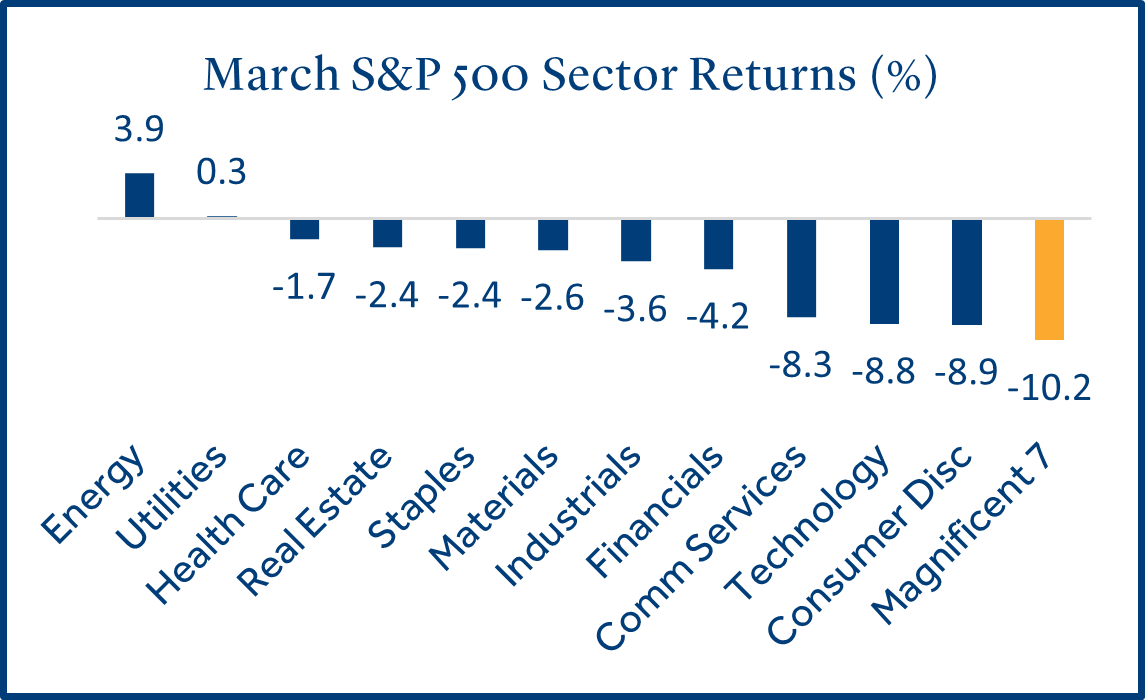
“Magnificent seven” stocks underperformed for the second consecutive month: Alphabet, Amazon, Apple, Meta, Microsoft, NVIDIA, and Tesla collectively declined -10.2% in March, following their -8.0% drop in February. NVIDIA declined -13.2% during the month, likely due to export restrictions to China and expectations for a drop in demand for their artificial intelligence microchips.
-
High dividend paying sectors led U.S. equity returns as market volatility increased: Higher yielding equity sectors like energy and utilities, which tend to be more defensive, held up well in March compared to growth-oriented sectors like technology and consumer discretionary.
-
Non-U.S. equities outperformed as fiscal spending is expected to increase: Several European countries are expected to boost their defense and infrastructure spending as the U.S. scales back military support in the region. European banks (+18%) boosted international stock returns year-to-date due to rising loan demand and supportive central bank policy2.
Fixed Income
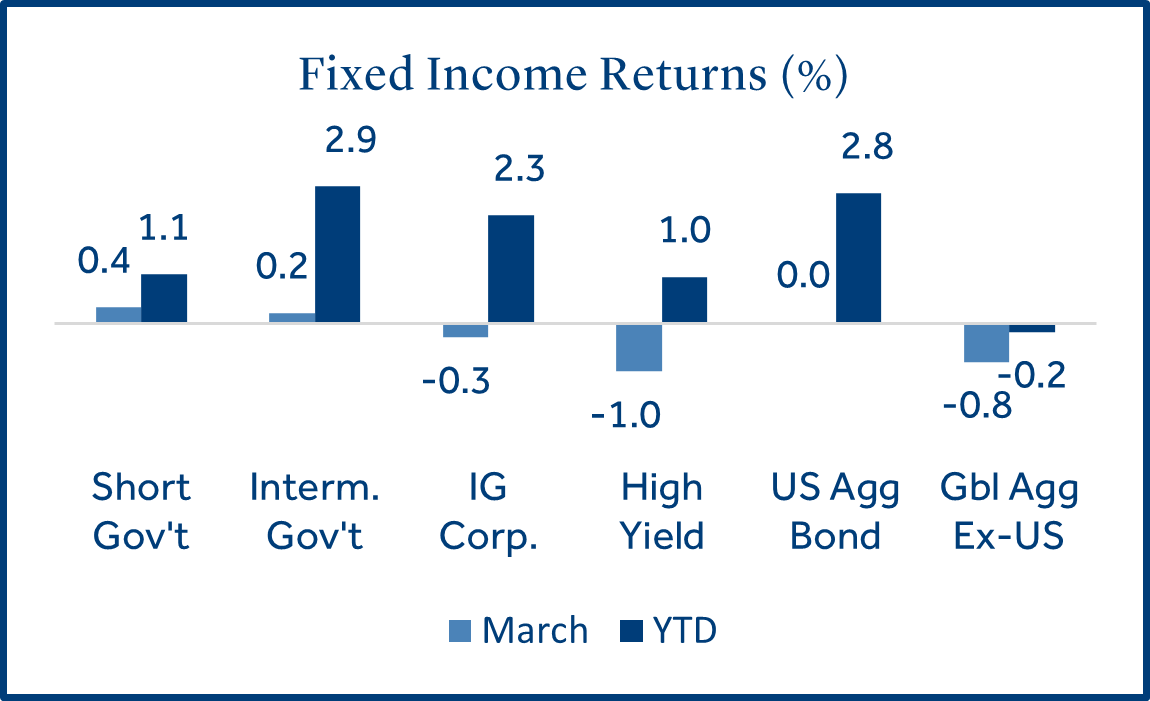
Bond returns were mixed as Treasury yields moved modestly lower.
U.S. Treasury yields remained in a holding pattern in March as investors await additional clarity on the health of the economy and U.S. trade policy.
-
Shorter-term rates were stable as the Fed opted to keep borrowing rates unchanged: Changes across the curve were modest as the Fed is expected to act slowly over the coming months. Demand for safety pushed two-year and five-year yields lower on tariff uncertainty.
-
Investment grade (IG) returns topped high yield (HY) on recession fears: IG bonds (rated BBB and above) carry less default risk versus HY bonds (rated BB and below). As economic growth estimates have declined, higher quality bonds outperformed. This could indicate declining risk appetite from investors. A-rated IG corporate bonds (higher quality) returned -0.2% while CCC-rated HY corporate bonds (lower quality) declined -2.7%.
Tariffs
Additional tariffs are expected in early April and could affect a wide range of countries and imported goods.
The tariffs are broadly intended to address illegal drug trafficking and immigration into the U.S. and to help balance uneven trade relationships.
-
Tariffs were levied earlier this year on China, Canada, and Mexico: A 20% tariff is in effect for all imports from China and a 25% tariff was enacted on goods from Canada and Mexico (with some exceptions). Additionally, a 25% global tariff on steel / aluminum began in March.
-
New tariffs could target the 10-15 nations that account for most of the U.S. trade deficit: The new tariffs would seek to counter current tariffs and other trade barriers these countries impose on U.S. goods. Key regions that could be impacted include the Eurozone, Canada, Mexico, and China. In addition, the administration announced a 25% global tariff on all imported cars and parts on March 26th (to go into effect on April 3rd).
-
The size and scope of tariffs levied will likely dictate the economic impact: U.S. tariff policy, and the retaliatory action from other countries continues to be fluid. The resulting uncertainty for global businesses has contributed to higher market volatility in 2025 as investors attempt to assess the effect on economic growth.
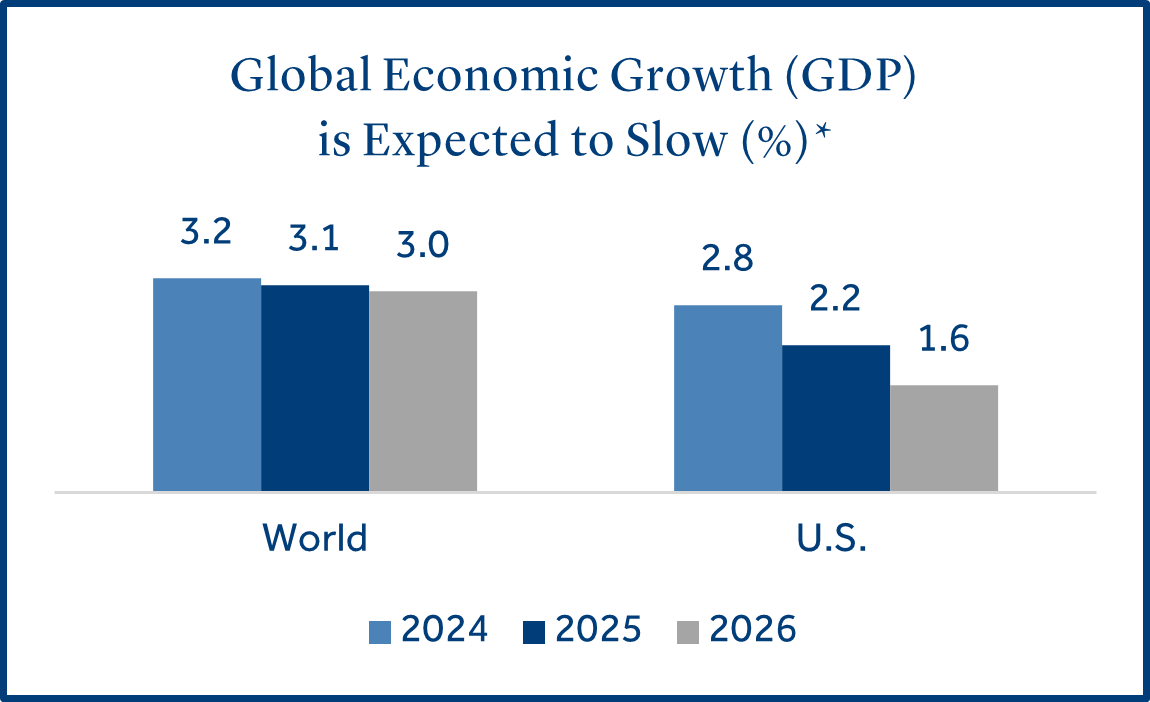
*Source: The OECD. Based on the assumption the U.S. will confirm tariffs on Canda and Mexico in April.
Federal Reserve
The Fed held short-term interest rates steady, citing uncertainty around the economy and inflation.
Fed officials held rates steady for the second straight meeting as they wait for additional clarity on a potential slowdown in economic growth and inflation that remained stubbornly high.
-
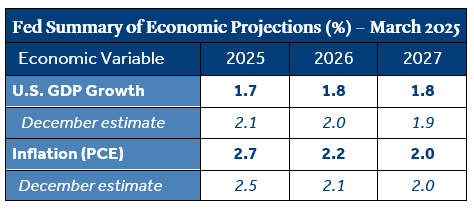
Fed Chair Jerome Powell stated the central bank is not in a hurry to adjust interest rates: Powell went on to say the Fed will likely wait for further clarity on fiscal policy and tariffs before acting. The current median estimate from Fed officials indicates there will be two 0.25% rate cuts in 20252.
-
The Fed will slow the decline of its balance sheet in April: The Fed plans to increase its Treasury purchases in April. This decision stems from concerns over the rising U.S. borrowing limit (debt ceiling) and its impact on interest rates. The Fed stated they will be proactive to curb any potential disruption in the bond market if lawmakers fail to strike a long-term deal on the debt ceiling.
-
The Fed expects slower growth and higher inflation: The Fed stated their outlook for monetary policy did not change much since their January meeting as their forecast for slower economic growth and higher inflation offset each other. The Fed’s outlook for GDP growth declined from +2.1% to +1.7% while the year-end inflation forecast increased from +2.5% to +2.7%3.
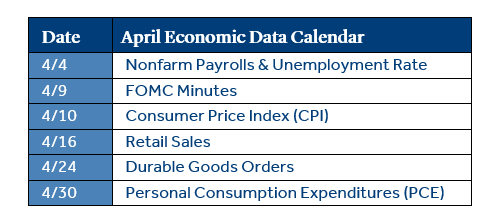
Economic Calendar
U.S. economic data continued to signal moderating growth.
Expectations for economic conditions in the U.S. deteriorated further in March. The near-term outlook from U.S. consumers for income, business, and labor market conditions declined to its lowest point since 20134.
-
February job growth missed expectations: New jobs created in February totaled +151k, below the forecast for +170k but above the +125k in January. Many of the DOGE-related layoffs occurred after the reporting period, meaning they will not be reflected until the March report. Even then, a sizable portion of the early retirement packages accepted by Federal employees are not effective until September.
-
Retail sales increased in February but not as much as expected: February retail spending increased +0.2% but was not as robust as the forecast (+0.6%). However, spending did return to positive territory following a -1.2% decline in January. Although sales did miss estimates, some analysts were upbeat that retail sales increased for the month given the recent decline in consumer sentiment.
-
CPI inflation decelerated during the month: Prices rose +2.8% (annualized) in February, less than the forecast (+2.9%) and a retreat lower compared to January (+3.0%). The report provided relief to consumers and businesses as inflation had risen in four consecutive months. Upcoming CPI reports are likely to be heavily scrutinized for the impact of tariffs.
Click here for a doanload of the full commentary.
Data and rates used were indicative of market conditions as of the date shown. Opinions, estimates, forecasts, and statements of financial market trends are based on current market conditions and are subject to change without notice. This material is intended for general public use and is for educational purposes only. By providing this content, Park Avenue Securities LLC is not undertaking to provide any recommendations or investment advice regarding any specific account type, service, investment strategy or product to any specific individual or situation, or to otherwise act in any fiduciary or other capacity. Please contact a financial professional for guidance and information that is specific to your individual situation. Indices are unmanaged and one cannot invest directly in an index. Links to external sites are provided for your convenience in locating related information and services. Guardian, its subsidiaries, agents, and employees expressly disclaim any responsibility for and do not maintain, control, recommend, or endorse third-party sites, organizations, products, or services and make no representation as to the completeness, suitability, or quality thereof. Past performance is not a guarantee of future results.
All investments involve risks, including possible loss of principal. Equities may decline in value due to both real and perceived general market, economic, and industry conditions. Fixed income securities involve interest rate, credit, inflation, and reinvestment risks, and possible loss of principal. As interest rates rise, the value of fixed income securities falls. Low-rated, high yield bonds are subject to greater price volatility. Investing in securities of smaller companies tends to be more volatile and less liquid than securities of larger companies. Investing in foreign securities may involve heightened risk including currency fluctuations, less liquid trading markets, greater price volatility, political and economic instability, less publicly available information and changes in tax or currency laws. Such risks are enhanced in emerging markets.
Asset class returns sourced from Morningstar Direct. Asset categories listed correspond to the following underlying indices: Large Cap (S&P 500), Small Cap (Russell 2000), Non-US Dev (MSCI EAFE), Emerging Markets (MSCI EM), Bonds (Bloomberg US Aggregate Bond), Short Gov’t (Bloomberg Short Treasury), Interm Gov’t (Bloomberg US Treasury), IG Corp (Bloomberg US Corp. Bond), High Yield (Bloomberg High Yield Corporate), Global Agg ex-US (Bloomberg Global Agg Ex US – Hedged), Magnificent 7 (Alphabet, Amazon, Apple, Meta, Microsoft, NVIDIA, and Tesla).
Treasury Yields sourced from the U.S. Department of the Treasury.
Inflation (CPI) sourced from the U.S. Bureau of Labor Statistics.
Unemployment statistics sourced from the Department of Labor.
1 Source: Morningstar Direct
2 Source: Bloomberg
3 Source: Federal Reserve
4 Source: The Conference Board
The Consumer Price Index (CPI) examines the weighted average of prices of a basket of consumer goods and services, such as transportation, food and medical care and is a commonly used measure of the rate of inflation.
Retail Sales represents the level of retail sales directly to U.S. consumers.
Durable Goods measure the cost of orders received by U.S. manufacturers of goods meant to last at least three years.
Fed Funds Rate: Short-term target interest rate set by the Federal Open Market Committee (FOMC); the policy making committee of the Federal Reserve. It is the interest that banks and other depository institutions lend money on an overnight basis.
S&P 500 Index: Index is generally considered representative of the stock market as a whole. The index focuses on the large-cap segment of the U.S. equities market.
Russell 2000 Index: Index measures performance of the small-cap segment of the U.S. equity universe.
MSCI EAFE Index: Index measures the performance of the large and mid-cap segments of developed markets, excluding the U.S. & Canada.
MSCI EM Index: Index Measures the performance of the large and mid-cap segments of emerging market equities.
Bloomberg US Aggregate Bond Index: Index measures the performance of investment grade, U.S. dollar-denominated, fixed-rate taxable bond market, including Treasuries, government-related and corporate securities, MBS, ABS, and CMBS.
Park Avenue Securities LLC (PAS) is a wholly owned subsidiary of The Guardian Life Insurance Company of America (Guardian). 10 Hudson Yards, New York, NY 10001. PAS is a registered broker-dealer offering competitive investment products, as well as a registered investment advisor offering financial planning and investment advisory services. PAS is a member of FINRA and SIPC.
PAS018129
7069921.9 (Exp. 3/27)

