
Monthly Market Commentary - April 2024
Monthly Market Commentary - April 2024
Monthly Update
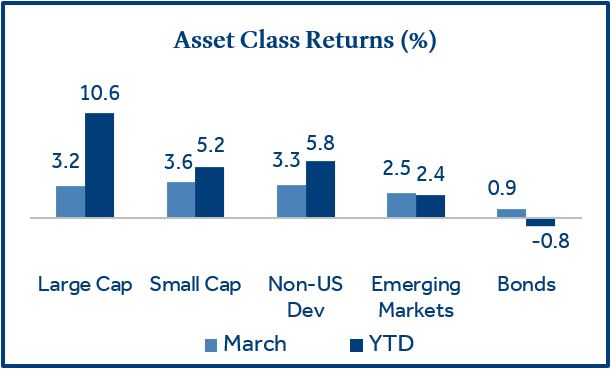
U.S. small cap stocks led asset class returns in March.
Although small stocks outperformed during March, domestic and non-U.S. large cap stocks continued their recent move higher as each notched their fifth consecutive month of gains.
- U.S. stocks rally broadly led by energy: Small cap stocks (Russell 2000 Index) gained +3.6% and outperformed large cap stocks (S&P 500 Index) which returned +3.2%. Value stocks outperformed growth stocks during the month as energy was the top performing sector within the Russell 2000 (+9.8%) and the S&P 500 (+10.6%).
- Bonds post first positive monthly return of 2024: Bonds (Bloomberg US Aggregate Bond Index) returned +0.9% as Treasury yields declined modestly in March as the Federal Reserve (the Fed) provided investors with comfort that the central bank was still on track for three interest rate cuts in 2024.
- Non-U.S. stocks led by Europe: Non-U.S. developed market stocks (MSCI EAFE Index) returned +3.3%; and outperformed Emerging Markets stocks (MSCI EM Index) which returned +2.5%. European equities (+3.7%) were higher on the prospect of potential rate cuts by the European Central Bank (ECB).
U.S. Equities
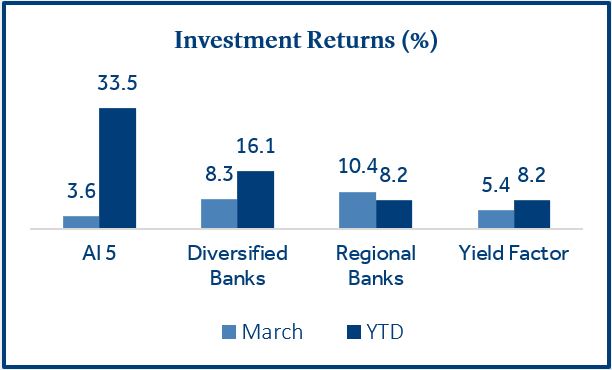
Artificial Intelligence (AI) stocks, bank stocks, and dividend paying stocks all pushed equity markets higher in March.
The move higher in equities during March was fueled by a variety of themes that spanned across value and growth sectors which could be an early sign that market leadership in 2024 may broaden out beyond the “magnificent seven” stocks that were dominant in 2023.
- AI stocks outperformed the tech sector: Five leading AI-related stocks (NVIDIA, Microsoft, AMD, Taiwan Semi, and Broadcom), recently dubbed the “AI 5”1, have driven returns in technology. After posting an average return of over 100% in 2023, positive momentum has carried over into the first quarter of 2024.
- Banks rose on the potential for rate cuts: Larger diversified banks and smaller regional banks both posted strong returns in March. The Fed reiterated rate cuts are likely in 2024 which should help normalize the yield curve (currently inverted) and potentially boost bank profits.
- Dividend paying stocks bounce back: Yield was the worst performing equity factor in 2023 and year-to-date through February. However, the potential for lower yields on money market funds and other fixed income investments as we move through 2024 could be increasing investor appetite for dividend paying equities.
Fixed Income
Higher bond yields could be offering an opportunity for investors looking to extend duration.
Money market assets were over $6 trillion at the end of March and remain near an all-time high2. Many investors have been hesitant to extend duration with money market yields exceeding 5% but we could be near an inflection point in fixed income markets if the Fed begins to cut rates.
- Higher bond yields can lower interest rate sensitivity: Higher bond yields may improve investment returns, but they can also dampen volatility. All else equal, bonds with a higher yield demonstrate greater price stability when interest rates rise and could improve overall portfolio diversification.
- Credit spreads near 2021 lows3: Corporate bonds normally offer higher yields than similar maturity Treasury bonds because of their expected higher chance of default. When the premium between corporate bond yields and Treasury bond yields (the “spread”) falls, this signals that investors are confident in the repayment of corporate bonds.
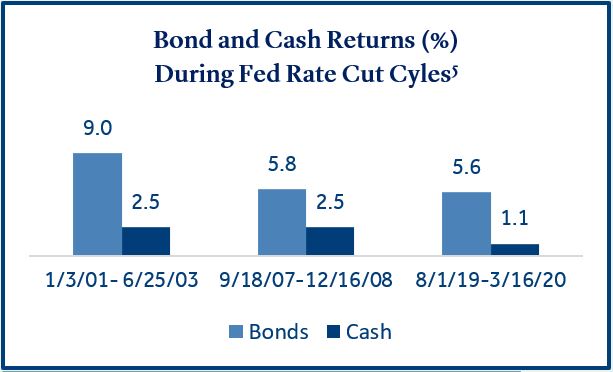
- Bonds have outperformed cash when the Fed Funds rate declines: Bonds provided meaningful outperformance relative to cash during the three rate cut cycles over the last twenty-five years. Further research suggests allocating to bonds three to six months in advance of the first rate cut in these cycles had only a small impact on returns4.
Commodities
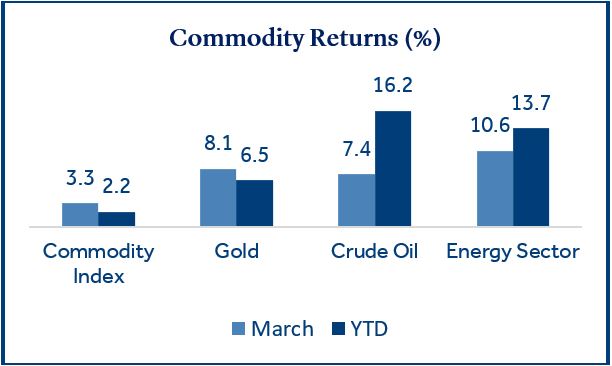
Gold prices reached an all-time high on the prospect of lower interest rates.
Commodity prices were challenged in 2023 as the fear of a U.S. recession and slowing growth in China served as headwinds to the asset class. However, gold was a top performer in 2023 and is off to a positive start in 2024. In addition, oil prices rose sharply in March which contributed to a strong month for energy stocks.
- Gold prices rose to a record high in March: Historically, gold tends to exhibit a negative correlation with interest rates and the Fed has indicated we are likely to see lower short-term interest rates later this year. Gold has also served as a haven during times of geopolitical risk, and rising tensions in the Middle East and the on-going conflict in the Ukraine may have spurred demand. Lastly, China’s central bank has been steadily accumulating gold to diversify its reserves away from the U.S. dollar6.
- Rising oil prices boosted energy stocks: OPEC supply cuts, rising tension in the Middle East, Ukrainian drone strikes on Russian oil producers, and an improving economic outlook in the U.S. and China all contributed to the climb in oil prices, which led to energy being the top performing sector within the S&P 500 in March.
Federal Reserve
The Fed held short-term rates steady but reiterated expectations for three 0.25% cuts in 2024.
There was some angst among investors heading into the Fed meeting on March 20 due to the two most recent inflation (CPI) reports coming in above estimates. However, Fed commentary following the meeting appears to have calmed fears the Fed could pivot to more restrictive policy.
- Inflation is trending lower but on a bumpy road: Fed Chair Powell acknowledged the hotter than expected inflation reports for January and February and suggested this was further evidence of inflation’s bumpy path down. He also noted low inflation readings in the second half of 2023 could make for some challenging comparisons later in 2024.
- Fed rate cut projections were unchanged: March data reflected a median forecast from Fed members that short-term rates would end the year -0.75% lower than the current range of 5.25% to 5.50%. Chairman Powell also added that a strong labor market wouldn’t deter the central bank from cutting rates.
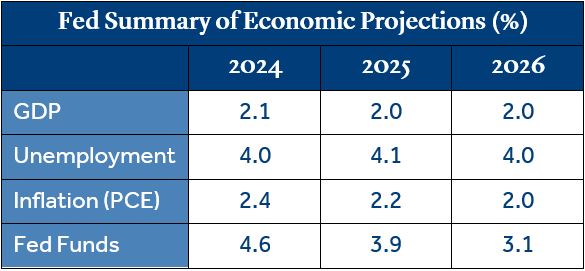
- The Fed increased estimates for economic growth: In its updated summary of economic projections for 2024, the Fed increased its forecast for gross domestic product (GDP) to 2.1% (from 1.4%), lowered projections for the unemployment rate to 4.0% (from 4.1%) and held inflation (PCE) steady at 2.4%.
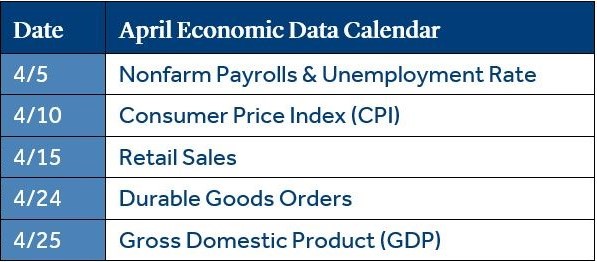
Economic Calendar
Investors will be looking for a dip in inflation (CPI) following three consecutive months above estimates.
- CPI exceeded expectations in February: This marked the third consecutive month annualized CPI was above consensus estimates. Many economists expected the “last mile” of inflation (moving from 3% down to the Fed’s target of 2%) to be challenging and recent comments from the Fed seem to have soothed investors for the time being. However, the potential risk to capital markets is that inflation flattens out for longer than anticipated (or rises), and results in the Fed taking a slower path with rate cuts.
- The labor market continued to be a source of strength for the U.S. economy: New jobs created in February totaled +275k and topped estimates of +198k. Average hourly earnings, a closely watched indicator for the direction of inflation, rose 4.3% from a year ago, down from 4.5% in January and below the 4.4% estimate.
- GDP expected to grow but at a slower pace: GDP was strong in the second half of 2023 and registered 4.9% in Q3 and 3.2% in Q4. Q3 was the highest level of growth in two years and although consumer spending was solid, the overall growth rate was likely an outlier due to elevated government spending. Estimates for Q1 2024 are currently 2.1%.
Click here to download the full report.
Data and rates used were indicative of market conditions as of the date shown. Opinions, estimates, forecasts, and statements of financial market trends are based on current market conditions and are subject to change without notice. This material is intended for general public use and is for educational purposes only. By providing this content, Park Avenue Securities LLC is not undertaking to provide any recommendations or investment advice regarding any specific account type, service, investment strategy or product to any specific individual or situation, or to otherwise act in any fiduciary or other capacity. Please contact a financial professional for guidance and information that is specific to your individual situation. Indices are unmanaged and one cannot invest directly in an index. Links to external sites are provided for your convenience in locating related information and services. Guardian, its subsidiaries, agents, and employees expressly disclaim any responsibility for and do not maintain, control, recommend, or endorse third-party sites, organizations, products, or services and make no representation as to the completeness, suitability, or quality thereof. Past performance is not a guarantee of future results.
Asset class returns sourced from Morningstar Direct. Asset categories listed correspond to the following underlying indices: Large Cap (S&P 500), U.S. Large Cap (S&P 500) Small Cap (Russell 2000), Non-US Dev (MSCI EAFE), Emerging Markets (MSCI EM), Bonds (Bloomberg US Aggregate Bond), European Equities (MSCI Europe), Diversified Banks (S&P 500 Diversified Banks), Regional Banks (S&P 500 Regional Banks, Yield Factor (Russell 1000 Yield Factor), Cash (FTSE Treasury Bill 3 Month), Commodity Index (Bloomberg Commodity), Gold (LBMA Gold Price PM), Crude Oil (Bloomberg WTI Crude Oil PR), Energy Sector (S&P 500 Sector/Energy).
Treasury yields sourced from the U.S. Department of the Treasury.
Inflation (CPI) sourced from the U.S. Bureau of Labor Statistics.
1 Source: Morningstar Direct. “AI 5” returns are a straight average of the return for NVIDIA, Microsoft, Advanced Micro Devices (AMD), Taiwan Semiconductor, and Broadcom over applicable time periods.
2 Source: Investment Company Institute.
3 Source: Federal Reserve Economic Data (FRED)
4 Source: Morningstar Direct. Investments in bonds or cash three to six months prior to the first rate cut in each cycle would have produced the following returns (annualized):
5 Source: Morningstar Direct. All returns annualized. Time periods reflect returns from the first Fed rate cut through the last Fed rate cut in the cycle.
6 Source: Bloomberg.
Credit spreads reflect the difference in yield between treasuries and corporate bonds of the same maturity.
Personal Consumption Expenditures (PCE) Price Index is the preferred inflation gauge for the Federal Reserve.
The Consumer Price Index (CPI) examines the weighted average of prices of a basket of consumer goods and services, such as transportation, food and medical care and is a commonly used measure of the rate of inflation.
Fund Funds Rate: Short-term target interest rate set by the Federal Open Market Committee (FOMC); the policy making committee of the Federal Reserve. It’s the interest that banks and other depository institutions lend money on an overnight basis.
Retail Sales represents the level of retail sales directly to U.S. consumers.
Durable Goods measure the cost of orders received by U.S. manufacturers of goods meant to last at least three years.
S&P 500 Index: Index is generally considered representative of the stock market as a whole. The index focuses on the large-cap segment of the U.S. equities market.
Russell 2000 Index: Index measures performance of the small-cap segment of the U.S. equity universe.
MSCI EAFE Index: Index measures the performance of the large and mid-cap segments of developed markets, excluding the U.S. & Canada.
MSCI EM Index: Index Measures the performance of the large and mid-cap segments of emerging market equities.
Bloomberg US Aggregate Bond Index: Index measures the performance of investment grade, U.S. dollar-denominated, fixed-rate taxable bond market, including Treasuries, government-related and corporate securities, MBS, ABS, and CMBS.
Park Avenue Securities LLC (PAS) is a wholly owned subsidiary of The Guardian Life Insurance Company of America (Guardian). 10 Hudson Yards, New York, NY 10001. PAS is a registered broker-dealer offering competitive investment products, as well as a registered investment advisor offering financial planning and investment advisory services. PAS is a member of FINRA and SIPC.
2024-172097 (Exp. 03/26)
PAS018160